Last reviewed 7 January 2026.
The short answer
To review your investment year in about 30 minutes, work through six timed steps: find your real money-weighted return (5 min), compare it to an index benchmark (4 min), list your three best and three worst decisions (6 min), check concentration and risk (5 min), name your one recurring mistake (6 min), and write a single rule for next year (4 min). Set a timer, answer the one question at each step, and stop when the timer stops. You do not need a perfect model — you need honest numbers and one thing to change.
Most people never review their investing year properly. They glance at the green or red number their broker shows on 31 December, feel a flicker of pride or dread, and move on. If you run two, three or four brokerage accounts, even that glance is unreliable — the balance went up partly because markets rose and partly because you kept paying money in, and no single screen separates the two. So the review that would actually make you a better investor never happens, because it feels like it would take an afternoon you do not have.
It does not have to. A useful annual review is not an accounting exercise; it is a decision audit. You want to know three things: did I actually do better than doing nothing, which of my decisions worked, and what mistake do I keep making? Everything below is built to answer those in half an hour. Each step has exactly one question and a strict time budget. When the timer for a step runs out, you write down your best answer and move on. Precision is not the goal — a completed review that you repeat every year beats a perfect one you never finish.
The six-step timed review at a glance
Here is the whole review in one table. Print it, or keep it open in a second window, and run a timer for each row. The times add up to exactly 30 minutes. The point of the budget is not speed for its own sake — it forces you to spend your attention where it changes behaviour (decisions and patterns) rather than where it feels productive but is not (re-deriving your exact return to the third decimal place).
| Step | The one question to answer | Time budget |
|---|---|---|
| 1. Real return | What did I actually earn, net of the money I paid in? | 5 min |
| 2. Benchmark | Did I beat simply buying and holding an index? | 4 min |
| 3. Best & worst | Which three decisions helped most, and which three hurt most? | 6 min |
| 4. Risk & concentration | Has any one position, sector or currency grown too large? | 5 min |
| 5. Recurring mistake | What error do I keep repeating across trades? | 6 min |
| 6. One rule | What single rule will I follow next year? | 4 min |
Do it by hand: the six steps, step by step
You can run every step of this with a calculator, your broker statements and a blank page. Here is exactly how, with a worked example running through it so the numbers are concrete.
Step 1 — Find your real return (5 minutes). The number your broker shows is the change in balance, which is polluted by deposits and withdrawals. To approximate what you actually earned, use a simple money-weighted estimate: return ≈ (ending value − starting value − net contributions) ÷ (starting value + half of net contributions). Worked example: you started the year with £40,000, ended at £52,000, and paid in £8,000 across the year. Gain from investing = 52,000 − 40,000 − 8,000 = £4,000. Average capital at work ≈ 40,000 + (8,000 ÷ 2) = £44,000. Return ≈ 4,000 ÷ 44,000 = 9.1%. That is far more honest than the 30% jump the raw balance implies. If your deposits were lumpy or you want to be exact, an XIRR formula in a spreadsheet is the rigorous version — but for a 30-minute review, the half-contribution estimate is close enough to act on.
Step 2 — Compare it to a benchmark (4 minutes). A 9.1% return is only good or bad relative to the alternative of doing nothing. Pick one broad index that matches most of your holdings — the S&P 500 total return for a US-heavy portfolio, a world index for a global one — and look up its return for the same year. If the index returned 15% and you made 9.1%, you underperformed buy-and-hold by roughly six points, and the honest conclusion is that your stock-picking cost you money this year. If it returned 4% and you made 9.1%, you added value. Write down both numbers and the gap. Do not rationalise the gap yet; just record it.
Step 3 — Find your best and worst decisions (6 minutes). Skim your realised and open positions and write two short lists: the three decisions that contributed most to your return and the three that cost the most. A "decision" is buying, selling, holding through a drop, or sitting in cash. Be specific: "held NVDA through the March dip: +£3,100" or "sold the miner after one bad week, it then doubled: −£1,900 of forgone gain". You are not scoring yourself; you are gathering evidence for step 5.
Step 4 — Check your concentration and risk (5 minutes). Add up what share of the total portfolio your single largest position now represents, and do the same for your biggest sector and, if you hold overseas, your biggest currency. Positions grow silently: a stock that ran up all year can quietly become 25% of everything while you weren't looking. There is no universal "too much", but if one name is above roughly 20% of the portfolio, or one sector above 40%, note it. Also glance at how deep your worst drawdown got during the year — the biggest peak-to-trough fall — and ask whether you were comfortable holding through it. If you weren't, that is a risk-tolerance signal worth acting on.
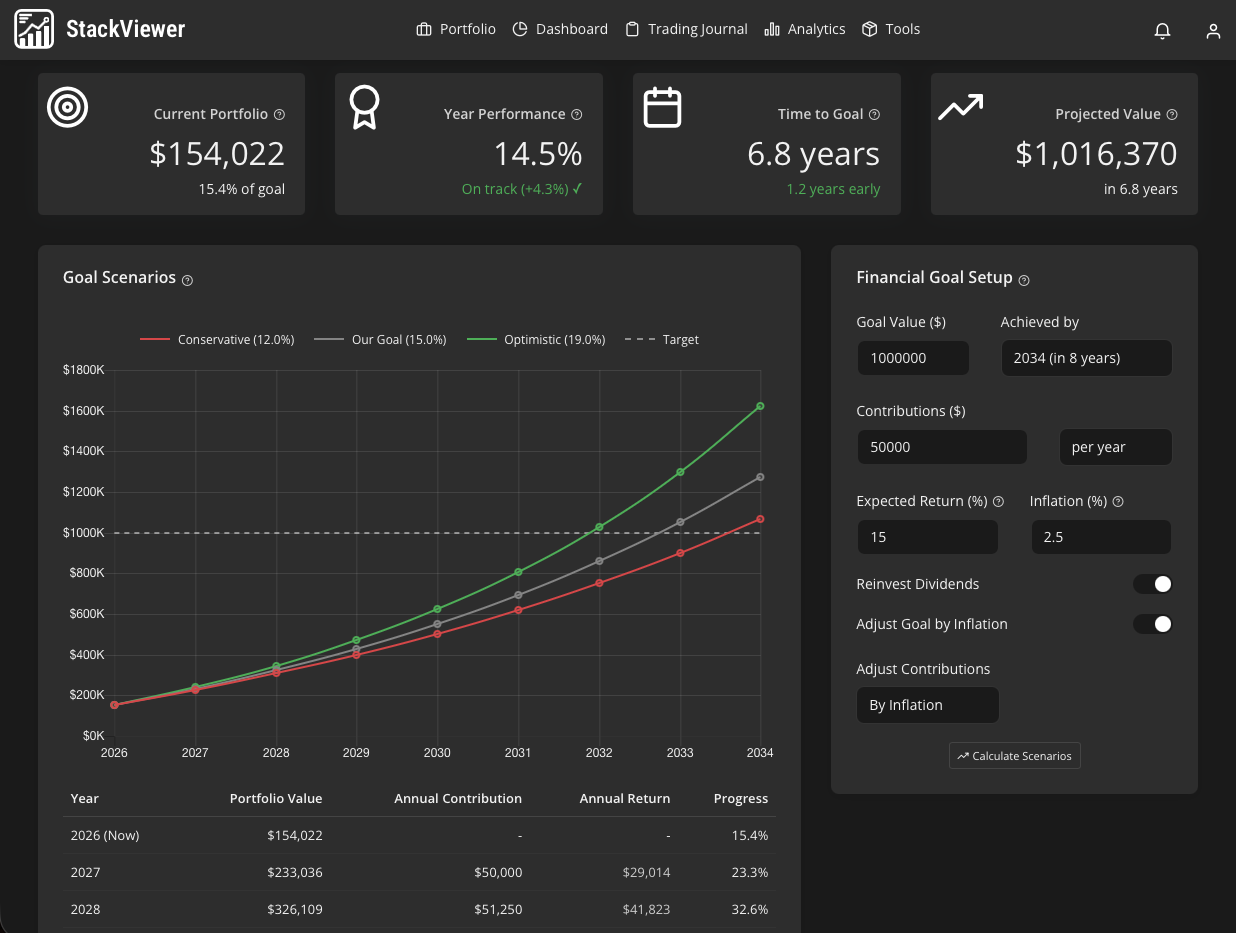
If pulling these numbers by hand across several brokers is the part that stops you doing the review at all, this is exactly what a tracker automates — real return, benchmark gap, concentration and drawdown in one screen. See it on the live demo portfolio →
Step 5 — Name your one recurring mistake (6 minutes). Look back at your best-and-worst lists from step 3 and ask what they have in common. Almost everyone has one dominant, repeating error. The classics: selling winners far too early to "lock in a gain", averaging down into losers that keep falling, buying whatever went up last month, or abandoning a thesis after one bad week. Try to state yours in a single sentence, in your own words. If three of your six worst outcomes were "sold too soon", you have found it. Naming the pattern is 80% of fixing it.
Step 6 — Write one rule for next year (4 minutes). Turn the mistake into a single, testable rule. Not a vague intention ("be more patient") but something you could later check yes/no against. Examples: "I will not sell a position that is up on the day of the sale unless my written thesis has broken." Or: "I will not add to any position that is already down more than 20% from my average cost." One rule. Write it where you will see it — the front of your journal, a pinned note. Next December, the first thing you check is whether you kept it.
Make it a repeatable December habit
The value of this review compounds only if you repeat it. A single year tells you little; three or four years of the same six answers reveal whether your real return consistently beats or trails the benchmark, whether your concentration keeps creeping up, and — most usefully — whether last year's rule actually changed your behaviour. That is why this is an evergreen habit rather than a one-off. Pick a fixed day — the week between Christmas and New Year is ideal, because brokers have posted the full year and you have quiet time — and put it in the calendar as a recurring event.
Keep your answers somewhere durable so next year's review can compare against them. A trading journal is the natural home: it already holds the reasons you gave when you opened each position, which makes step 3 and step 5 far faster and far more honest, because you're comparing what you predicted against what happened rather than reconstructing your reasoning from memory. If you don't keep one yet, start with the single rule from step 6 — that alone is a journal of one entry, and it is the entry that matters most.
One caution on the numbers: treat your real-return and benchmark figures as directional, not audited. A 30-minute review is meant to surface the two or three things worth acting on, not to produce tax-grade accounting. If a number will drive a real decision — a large rebalance, a tax-loss harvest — verify it properly against your official statements before you act.
What this doesn't tell you
This review is built for investors who hold for months to years, not for day traders — if you're turning over positions daily, a 30-minute annual look-back is far too coarse to help you. The half-contribution return formula is an approximation; irregular or large mid-year deposits can skew it, and only a proper XIRR captures the timing precisely. The method also assumes your holdings map cleanly onto a single index benchmark, which breaks down if you hold a lot of alternatives, private assets or crypto. And whatever tool you use to gather the numbers, remember that portfolio trackers — StackViewer included — are not real-time: StackViewer syncs your connected brokers three times a day and refreshes values roughly every half hour, which is perfect for an annual review but useless for intraday decisions. It also can't see custom or off-platform assets you haven't entered, and coverage of some EU brokers has gaps. None of this changes the value of the exercise; it just means you should read the outputs as a well-lit summary, not a source of truth.
Frequently asked
- When is the best time to review my investment year?
- Any fixed annual point works, but late December or early January is easiest because most brokers have posted the full year's transactions and tax documents are near. The habit matters more than the exact date, so pick one day and repeat it every year.
- How long should an annual portfolio review take?
- About 30 minutes if you keep to a time budget per step. This review is deliberately timed so you spend your attention on decisions and patterns rather than sinking hours into rebuilding spreadsheets.
Run your whole year's review from one screen
Real return, benchmark gap, concentration, drawdown and your decision history — across all your brokers, ready when you sit down in December. The demo portfolio shows exactly what the six steps look like with real data.
See the live demo or start freeNo credit card · Read-only broker access · Free forever plan

We build a portfolio tracker and trading journal for long-term investors running several brokers. We write about the maths and the behaviour behind better investing decisions — and we're honest about what the tools can and can't do.
This article is for information only. It is not financial, investment or tax advice, and nothing here is a recommendation to buy or sell any security. StackViewer analyses decisions you have already made; it does not predict returns. Past performance does not indicate future results.