Last reviewed 26 March 2026.
The short answer
To know whether you are beating the S&P 500, calculate your time-weighted return (TWR) over a chosen period, then compare it to the S&P 500 Total Return index (ticker SP500TR / ^SP500TR, dividends reinvested) — not the price index on the news — over the exact same dates and in the same currency. If your TWR exceeds the index's total return over that window, you're ahead; if not, you're behind. Your broker's headline "return" figure is almost never comparable, because it usually mixes in the timing of your own deposits and ignores reinvested dividends.
You checked your brokerage app this morning and it said you were up 14% this year. The S&P 500 is up something like 11%. So you're beating the market — right? Maybe. But that 14% almost certainly isn't measuring what you think it's measuring, and the 11% you're comparing it to is probably the wrong number too. Two mistakes, pulling in opposite directions, and you have no idea which way the truth sits.
Beating the index is the question every self-directed investor secretly wants answered, and it's surprisingly easy to get wrong — usually in a way that flatters you. This guide walks through the maths by hand, with real numbers, so you can produce a figure you actually trust. It takes about twenty minutes the first time. After that you'll never look at a broker's headline return the same way again.
Step 1: get your time-weighted return (TWR)
The number your broker shows is contaminated by the timing and size of your own cash flows. If you deposited a large sum right before a rally, a naive return calculation credits you for a market move you had nothing to do with. If you added money right before a dip, it punishes you unfairly. The fix is the time-weighted return, which strips out the effect of deposits and withdrawals so you measure the performance of your decisions, not your savings rate.
Here's the method by hand. Break your period into sub-periods, cutting a new slice every time cash moves in or out. Calculate the return of each sub-period using the value just before the cash flow, then chain-link them together. The formula for chaining is:
TWR = [(1 + r₁) × (1 + r₂) × … × (1 + rₙ)] − 1
where each sub-period return is r = (End value − Cash flow − Start value) / Start value. Let's work a concrete example. Say you start the year with £20,000. By 30 June the portfolio is worth £22,000, at which point you deposit £5,000 (bringing it to £27,000). By 31 December it's worth £30,000.
| Sub-period | Calculation | Return |
|---|---|---|
| 1 Jan – 30 Jun | (22,000 − 20,000) / 20,000 | +10.00% |
| 1 Jul – 31 Dec | (30,000 − 27,000) / 27,000 | +11.11% |
| Chain-linked TWR | (1.10 × 1.1111) − 1 | +22.22% |
Your true time-weighted return is 22.22%. Notice that a simple "end minus contributions over start" calculation would have given you a different, misleading figure because it treats the mid-year £5,000 as if it had been there all along. The TWR is the only version that can be fairly set against an index — because an index has no deposits either. If you have many cash flows, the arithmetic is the same, just with more sub-periods; a spreadsheet handles it in a couple of minutes.
Step 2: pick the right benchmark — and the total-return version
Now the two mistakes almost everyone makes. First, the wrong benchmark. The S&P 500 is a US large-cap index. If your portfolio is broadly US large-cap stocks and ETFs, it's a fair yardstick. But if you hold a global tracker, emerging markets, UK or European stocks, small caps, bonds or a big cash buffer, the S&P 500 is not your benchmark — you'd be comparing apples to a different fruit entirely. A globally diversified investor should compare against something like the MSCI World or FTSE All-World total return; a 60/40 investor should blend an equity and a bond index in the same proportions. Beating or lagging the S&P 500 tells a global investor almost nothing.
Second — and this is the one that trips up nearly everyone — use the total-return index, not the price index. The "S&P 500" number quoted on the news, on your broker's ticker, and on most finance sites is the price index: it tracks share prices only and ignores dividends. But your own portfolio almost certainly reinvests or receives dividends, so measuring your dividend-inclusive return against a dividend-excluding index is not a fair fight. It silently hands you a head start of roughly 1.5 to 2 percentage points a year.
The fix is simple: benchmark against the S&P 500 Total Return index, ticker SP500TR or ^SP500TR on most data providers. It assumes dividends are reinvested, which mirrors what a real index fund holder experiences. If you can only find the price index, you can approximate by adding the S&P 500's dividend yield for the period, but pulling the total-return series directly is cleaner and free on several sites. This single correction reverses a lot of "I'm beating the market" conclusions.
If pulling the total-return series and chain-linking sub-periods sounds like a chore, our free market checker does exactly this on your live data and shows the like-for-like gap. See it on the live demo portfolio →
Steps 3–5: match dates, handle currency, then compare
Step 3 — match the date range exactly. This sounds obvious and it's constantly ignored. If your TWR runs 1 January to 31 December, measure the index's total return over precisely those dates — same start, same end, same closing prices. Comparing your year-to-date figure against a rolling 12-month index return, or against a calendar year when yours starts mid-year, quietly injects weeks or months of market movement into one side of the comparison and not the other. Pick a window, lock it, and apply it to both.
Step 4 — handle currency. If you're a UK or European investor holding US stocks, part of your return is the stock and part is the dollar moving against your home currency. The S&P 500 Total Return index is quoted in dollars. To compare fairly, either convert your portfolio's start and end values into USD using the spot rate on each date and compare in dollars, or convert the index into your home currency across the same window. What you must not do is compare your GBP portfolio return to the USD index return — a strong or weak dollar would masquerade as skill or failure. Be consistent: one currency, both sides.
Step 5 — compare and interpret. Subtract the benchmark's total return from your TWR over the same window. That difference is your excess return, or alpha in plain terms. In our worked example, if the S&P 500 Total Return delivered +18% over the identical dates and currency, your 22.22% TWR means you beat it by about 4.2 points that year. But interpret with humility: one good year is mostly noise. Sequence, luck, and a couple of concentrated positions can dominate a single twelve-month stretch. The question "am I beating the market?" is only meaningful over three to five years or more, ideally on a risk-adjusted basis — a return earned by taking wild risks isn't the same as one earned steadily.
This is also where your broker's number falls apart on closer inspection. A broker's headline "return" is typically a money-weighted or simple figure over a window it chose (often year-to-date), it ignores dividends the way the price index does, and it rarely reconciles across multiple accounts. If you run two or three brokers — as most investors reading this do — no single broker can even see your whole portfolio, let alone benchmark it correctly. That's exactly the gap this whole exercise closes, and why your broker's headline number isn't comparable to an index without the corrections above.
What this doesn't tell you
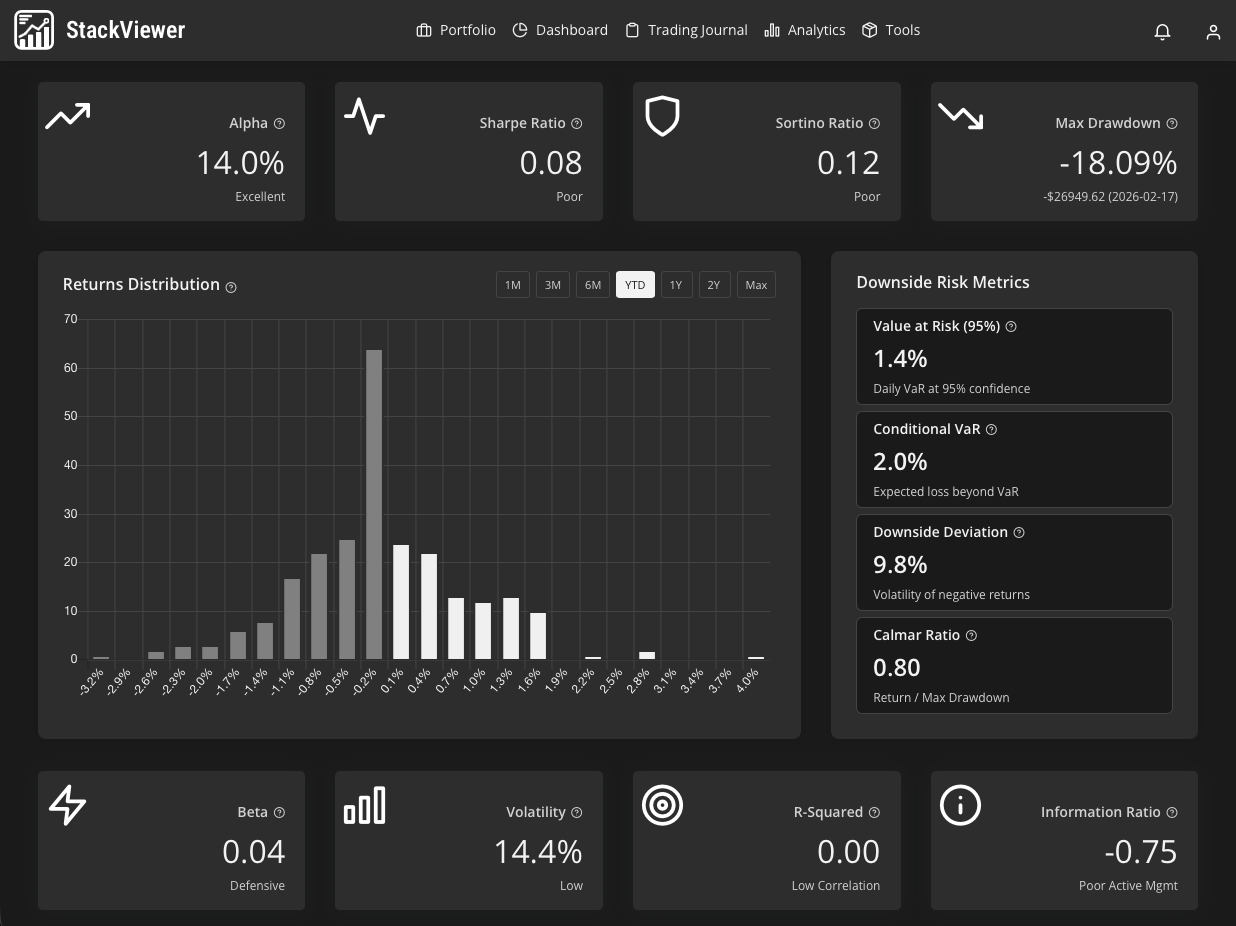
A few honest limits. First, beating or lagging the index over one period says little about skill; you need years of data and ideally a risk-adjusted view (Sharpe, Sortino, alpha, beta) before drawing conclusions. Second, this method is for months-to-years investors — it is not a day-trading scorecard and won't help intraday. Third, StackViewer's figures are not real-time: we sync three times a day and refresh values roughly every 30 minutes, which is right for long-horizon tracking but not for live positions. Fourth, if you hold custom or unlisted assets, private holdings, or use a broker we don't yet connect to (coverage is strongest in the US/UK and thinner for some EU brokers), your benchmark comparison will only be as complete as the data we can see. And finally, an index comparison is a mirror, not a crystal ball — it tells you what already happened, never what will.
Frequently asked
- Should I use the S&P 500 price index or the total return index?
- Use the total return index (SP500TR). The price index you see quoted on the news excludes dividends, which have historically added roughly 1.5 to 2 percentage points a year. Comparing your dividend-inclusive portfolio to the price-only index flatters your result and is the single most common mistake.
- Why is my broker's return different from the number I calculated?
- Most brokers show a simple or money-weighted return over a fixed window (often year-to-date) that mixes in the timing and size of your deposits. That is not comparable to an index. To compare against the S&P 500 you need a time-weighted return over the exact same dates, in the same currency, versus the total-return index.
Get the honest answer in one screen
StackViewer calculates your time-weighted return across all your brokers, pulls the S&P 500 Total Return over matching dates in your currency, and shows the gap — no spreadsheet required.
See the live demo or start freeNo credit card · Read-only broker access · Free forever plan

We build portfolio-tracking and trading-journal tools for long-horizon investors running two to four brokers. We write about performance measurement the way we wish someone had explained it to us — maths first, honestly, no hype.
This article is for information only. It is not financial, investment or tax advice, and nothing here is a recommendation to buy or sell any security. StackViewer analyses decisions you have already made; it does not predict returns. Past performance does not indicate future results.