Last reviewed 8 April 2026.
The short answer
A trading journal for long-term investors should record eight things at the moment you buy: the date and price, the position size as a percentage of your portfolio, a one-sentence thesis, the catalyst and time horizon, the invalidation (what would prove you wrong), your conviction level, the emotion driving the decision, and where the idea came from. Write the entry at entry — never reconstruct it at exit, because by then you already know the outcome and your memory will quietly rewrite the reasoning. Everything else — tick-by-tick prices, broker fees, chart screenshots — is noise for a months-to-years investor and can be skipped. Get those eight fields down consistently and you can review six months of decisions in about twenty minutes.
You buy a handful of positions a year. Maybe you add to an index fund every month, take a real swing at three or four individual names, trim something that got too big, and sell one holding you finally lost patience with. That is the whole trading year for most long-term investors. And that is exactly the problem: with so few decisions, you have almost no sample size to learn from, and the gap between the decision and the outcome can stretch across years. By the time a position pays off or blows up, you have forgotten why you bought it and what you were feeling at the time.
A trading journal fixes that — but the journals sold to day traders are the wrong tool. They are built around entries and exits measured in minutes, with fields for slippage, spread, and setup type that mean nothing when your holding period is measured in years. What a long-term investor needs is a short, honest record of the reasoning behind each decision, written once, at the point of decision. This page is the category standard for how to do that: which eight fields to record, which fields quietly waste your time, why the timing of the entry matters more than its contents, and how to turn a year of entries into a twenty-minute review that actually changes how you invest. There is a free investment journal template at the end.
The eight fields worth recording
Most journal templates fail in one of two directions: they ask for too little (just ticker, date, and price, which tells you nothing you cannot get from your broker), or they ask for so much that you stop filling them in by March. The right number of fields for a long-term investor is eight. Each one earns its place because it answers a question you will genuinely ask yourself later — and because you can fill it in from memory in under a minute while the decision is fresh. Here is the manual method, no software required: open a spreadsheet, make these eight columns, and add a row every time you buy, add, trim, or sell.
| Field | Why it matters | Worked example |
|---|---|---|
| Date & price | Anchors the decision in time so you can measure the holding period and reconstruct the market context later. | 2026-03-14, bought at £41.20 |
| Position size (% of portfolio) | Percentage, not cash. It tells you how much conviction you actually had — the true signal of what you believed. | 4% of portfolio |
| Thesis (one sentence) | Forces you to state the bet plainly. If you cannot write it in one sentence, you do not have a thesis yet. | “Margins recover as freight costs normalise into 2027.” |
| Catalyst & time horizon | Names what has to happen and by when, so “it hasn't worked yet” becomes a checkable claim rather than a feeling. | FY27 guidance; 18–24 months |
| Invalidation | The single most valuable field. What would prove you wrong? Written now, it stops you rationalising later. | “Gross margin below 22% for two quarters.” |
| Conviction (1–5) | A quick self-rating. Reviewing conviction against outcome shows whether your gut is worth listening to. | 4/5 |
| Emotion | Name the feeling: FOMO, patience, fear, boredom. Emotion is the variable that predicts your worst decisions. | Slight FOMO after the earnings pop |
| Source of idea | Tracks where your good and bad ideas come from — your own research, a newsletter, a forum, a friend. | Own screen + annual report |
Notice what is not on that list. You do not need to log fees or commissions — your broker already has them and they barely move a multi-year return. You do not need chart screenshots or technical setups; they are decoration for a holding period measured in years. You do not need a running P&L column, because your broker computes that automatically and staring at it daily is the exact behaviour a journal is meant to cure. You do not need a “target price” field either — it invites false precision and gets ignored. If a field does not help you judge the quality of the decision independently of the outcome, it is wasting your time. The eight above are the ones that survive that test. Keep the exit columns (exit date, exit price, exit reason) empty until you actually sell; filling them in early is the single most common way people quietly corrupt a journal.
Why you write the entry at entry, not at exit
This is the rule that separates a journal that teaches you something from a diary that flatters you. The entry must be written at the moment of the decision, before you know how it turns out. The reason is hindsight bias — the well-documented tendency, once you know an outcome, to believe you “knew it all along.” If you sell a winner and only then write down why you bought it, your brain hands you a clean, confident thesis that conveniently matches the happy ending. If you sell a loser and reconstruct the entry, you will either invent a reason you were unlucky or quietly delete the embarrassing FOMO that actually drove the purchase. Either way, the record is fiction, and you learn nothing.
Written at entry, the same eight fields become a sealed prediction you cannot argue with later. Consider a real pattern: an investor buys a stock at a conviction of 4/5 with the emotion honestly logged as “FOMO after the earnings pop.” Eighteen months later the position is up 30%. It looks like a great call. But the journal shows the catalyst they named never actually materialised — the stock rose for unrelated reasons. That is a lucky decision, not a good one, and only the entry-time record can tell them apart. Over enough entries, this distinction is the whole game: you want to repeat good decisions and stop repeating lucky ones, because luck does not compound.
The invalidation field does the heaviest lifting here. Written at entry — “gross margin below 22% for two quarters” — it becomes an objective tripwire. When margins slip, you do not get to debate whether the thesis is broken; you wrote the answer down yourself, months ago, when you were calm. This is also where thinking in R-multiples helps: defining your invalidation is really defining your risk (your R), so a journal and a risk framework are two halves of the same discipline.
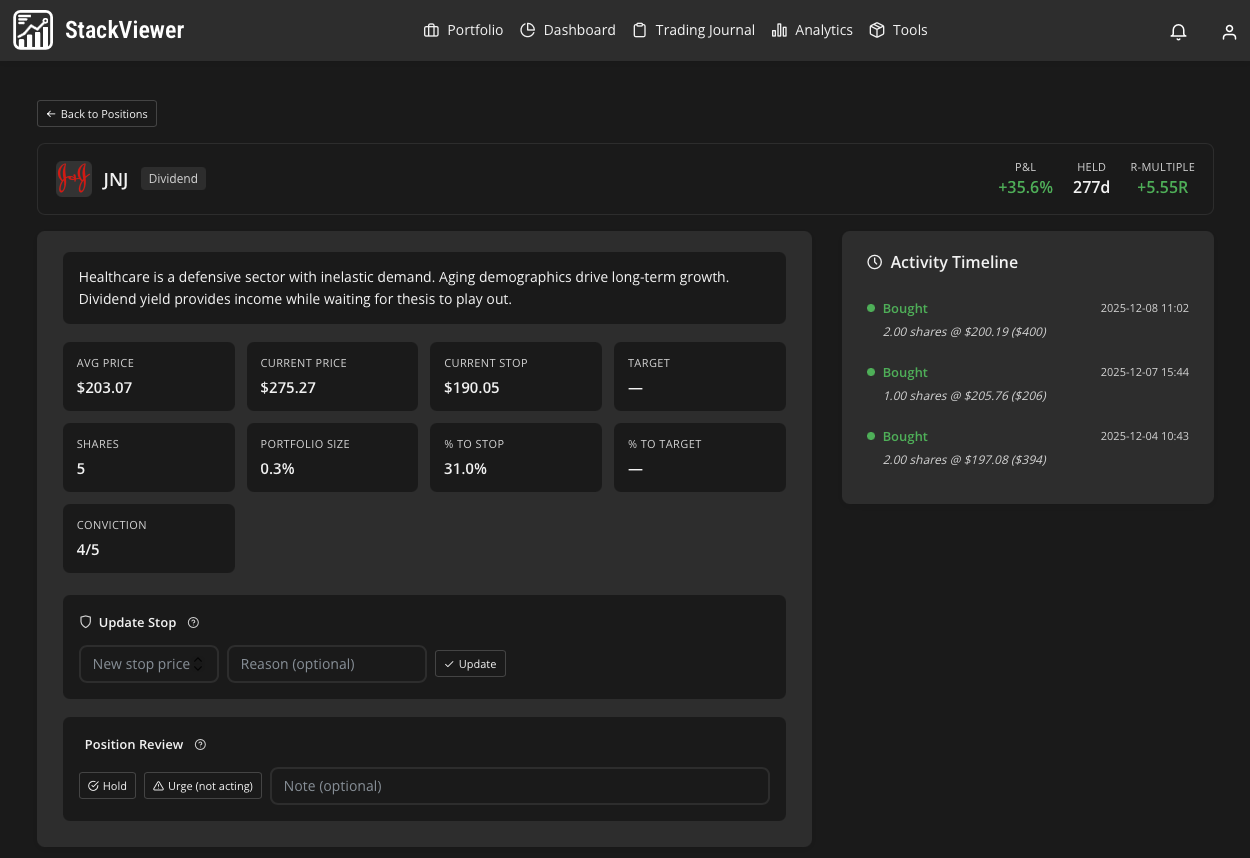
If tagging every decision by reason, conviction and emotion in a spreadsheet sounds like admin, StackViewer captures those tags at the point of the trade and syncs the position automatically. See it on the live demo portfolio →
How to review six months of entries in twenty minutes
A journal you never re-read is just a chore. The payoff comes from review — and for a long-term investor, review should be rare and fast. Do it twice a year, around thirty entries at a time, in a single twenty-minute sitting. You are not re-analysing each position; you are scanning for patterns across decisions. Here is the manual process, one pass per column:
Pass one — invalidations (about 5 minutes). Read down the invalidation column only. For each open position, has the tripwire been hit? If yes and you are still holding, that is the finding — flag it. You are not deciding to sell in the review; you are surfacing the decisions that have quietly drifted from their own rules.
Pass two — decision quality vs outcome (about 8 minutes). For each closed position, put the outcome (up/down) next to the conviction and thesis you recorded at entry. Sort into four buckets: high-conviction winners where the catalyst you named actually happened (repeat these), high-conviction losers where the invalidation triggered and you held too long (your costliest habit), low-conviction winners that were luck (do not take false confidence from them), and low-conviction losers you should probably never have bought. The lesson lives in the mismatches, not the wins.
Pass three — emotion and source (about 7 minutes). Read the emotion column across every entry. Do your FOMO buys underperform your patient ones? Does one newsletter in your “source” column keep appearing next to your worst rows? This is behavioural pattern-spotting, and it is where most investors find the one habit worth breaking. Our full behavioural investing playbook walks through the tags and what each pattern usually means.
Done by hand, twenty minutes is realistic once you have the four buckets memorised. StackViewer’s behavioural analysis runs these three passes for you — it groups closed positions by conviction and outcome, surfaces which emotion tags cluster around your losses, and shows the same fifteen-plus risk metrics (Sharpe, Sortino, Alpha, Beta, Max Drawdown, VaR) against your journalled decisions, so the review is a read rather than a spreadsheet-wrangling exercise. If you would rather see how a purpose-built journal compares to the day-trading tools, our StackViewer vs TradeZella comparison lays out where each one fits.
What this doesn't tell you
A few honest caveats. First, no journal will tell you what to buy or predict a return — it only helps you judge decisions you have already made. Second, StackViewer is built for months-to-years investors running two to four brokers; it is not a real-time tool. Positions sync three times a day and values refresh roughly every thirty minutes, so if you are a day trader who needs live tick data and sub-second fills, this is the wrong tool and a dedicated day-trading journal will serve you better. Third, we connect to 31 brokers via read-only OAuth (through SnapTrade), which is deliberately broad but not universal — some EU brokers are not yet supported, and custom or private assets (unlisted holdings, physical property, collectibles) cannot be synced automatically and have to be tracked by hand. Fourth, the automatic reason/conviction/emotion tags are only as honest as the moment you record them; the discipline of writing at entry is on you, not the software. And finally, the manual spreadsheet method in this article works perfectly well — you do not need any product to keep a good journal. What software buys you is the automatic sync and the review passes done for you, not the discipline itself.
Frequently asked
- Do long-term investors really need a trading journal?
- Yes, arguably more than active traders. When you only make a handful of decisions a year, you have almost no sample size to learn from, and the gap between decision and outcome can be years. A journal captures your reasoning while it is fresh so that when a position finally plays out, you can judge whether the decision was sound rather than just whether it was lucky.
- What is the single most important field in an investment journal?
- The invalidation line: what would have to happen for you to admit the thesis is wrong. It is the field most people skip and the one that does the most work at review time, because it converts a vague feeling of regret into a clear yes-or-no test you can score honestly.
Get the free investment journal template
The eight-field spreadsheet from this article, pre-built with the entry and exit columns, the four review buckets, and worked examples. Enter your email and we’ll send the template plus a short guide to running your twice-yearly review.
Prefer to see it working on a real portfolio first? See the live demo or start free
No credit card · Read-only broker access · Free forever plan

We build a portfolio tracker and trading journal for long-term investors running a handful of brokers. We write about the habits and metrics that actually change how people invest — and we are honest about what our own tool can and cannot do.
This article is for information only. It is not financial, investment or tax advice, and nothing here is a recommendation to buy or sell any security. StackViewer analyses decisions you have already made; it does not predict returns. Past performance does not indicate future results.