Stop Guessing.
Start Investing Smarter.
StackViewer unifies all your brokerage accounts, analyzes your trading patterns, and uses AI to help you become a better investor — one decision at a time.
No credit card required · Read-only broker access · Cancel anytime
Not just another portfolio tracker
Most tools tell you what your balance is. StackViewer shows you why — and how to do better.
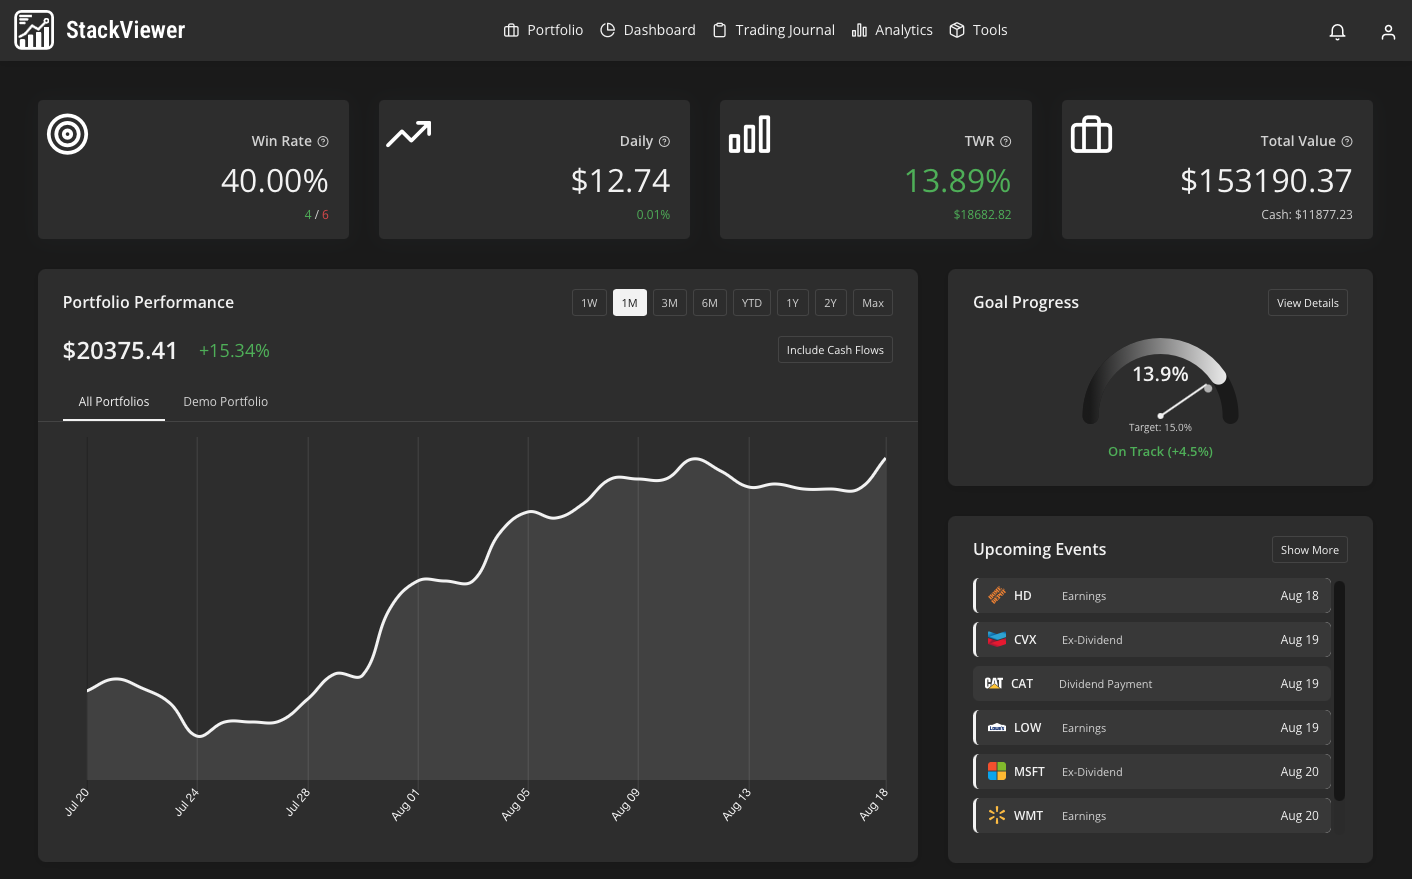
Every account.
One number that matters.
Stop logging into five brokers to piece together your net worth. Connect them once and StackViewer keeps a single, always-current view of your money — with the metrics that actually tell you how you're doing.
An analyst that read
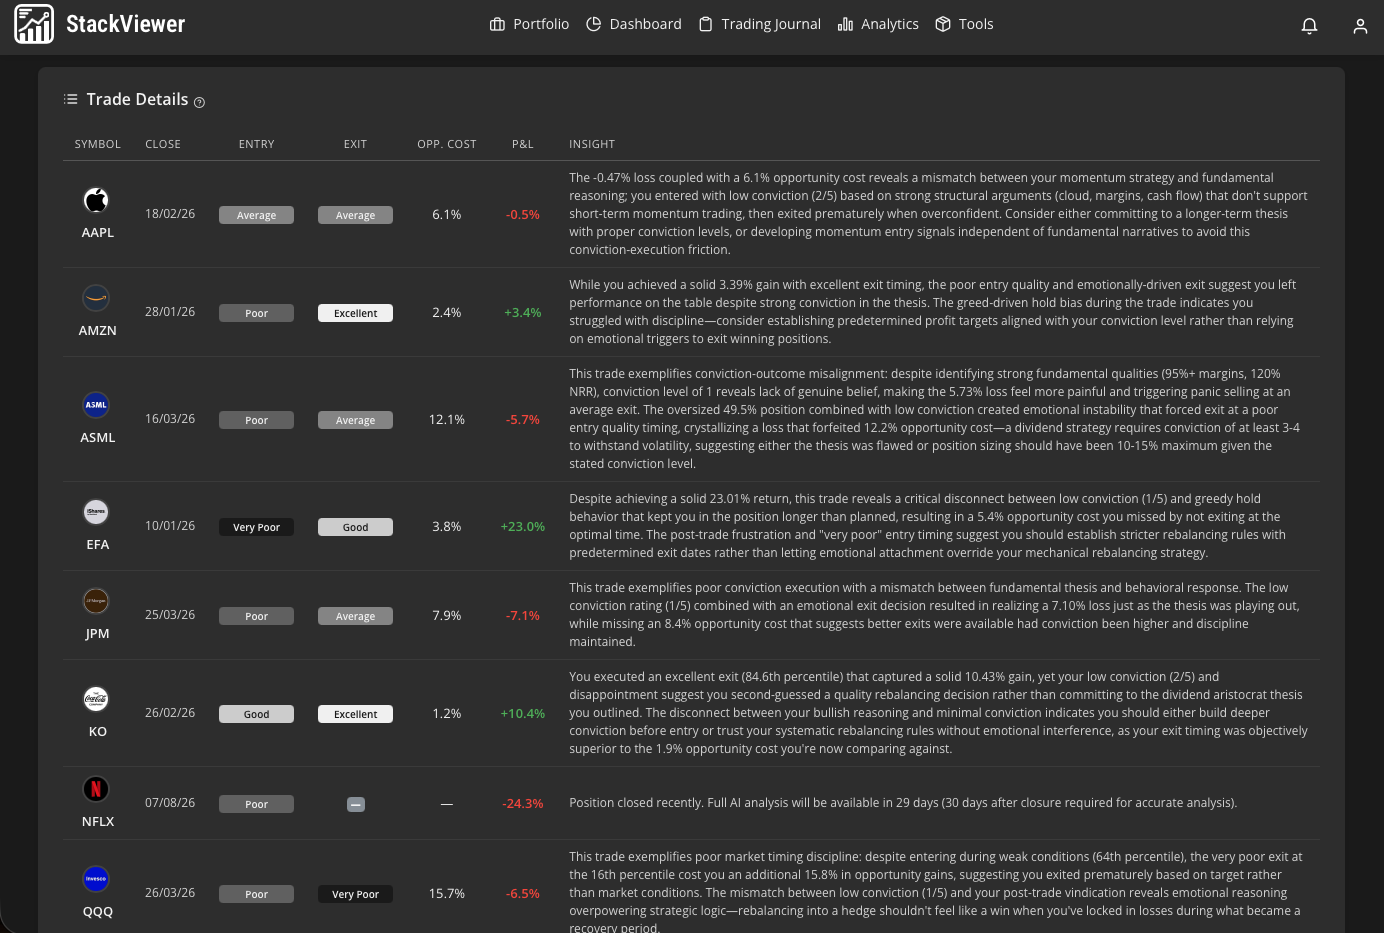
every trade you ever made.
StackViewer's AI grades every position on entry and exit quality, calculates what your timing actually cost you, and writes a plain-English breakdown of the behavior behind the result — the biases and habits you'd never catch on your own.
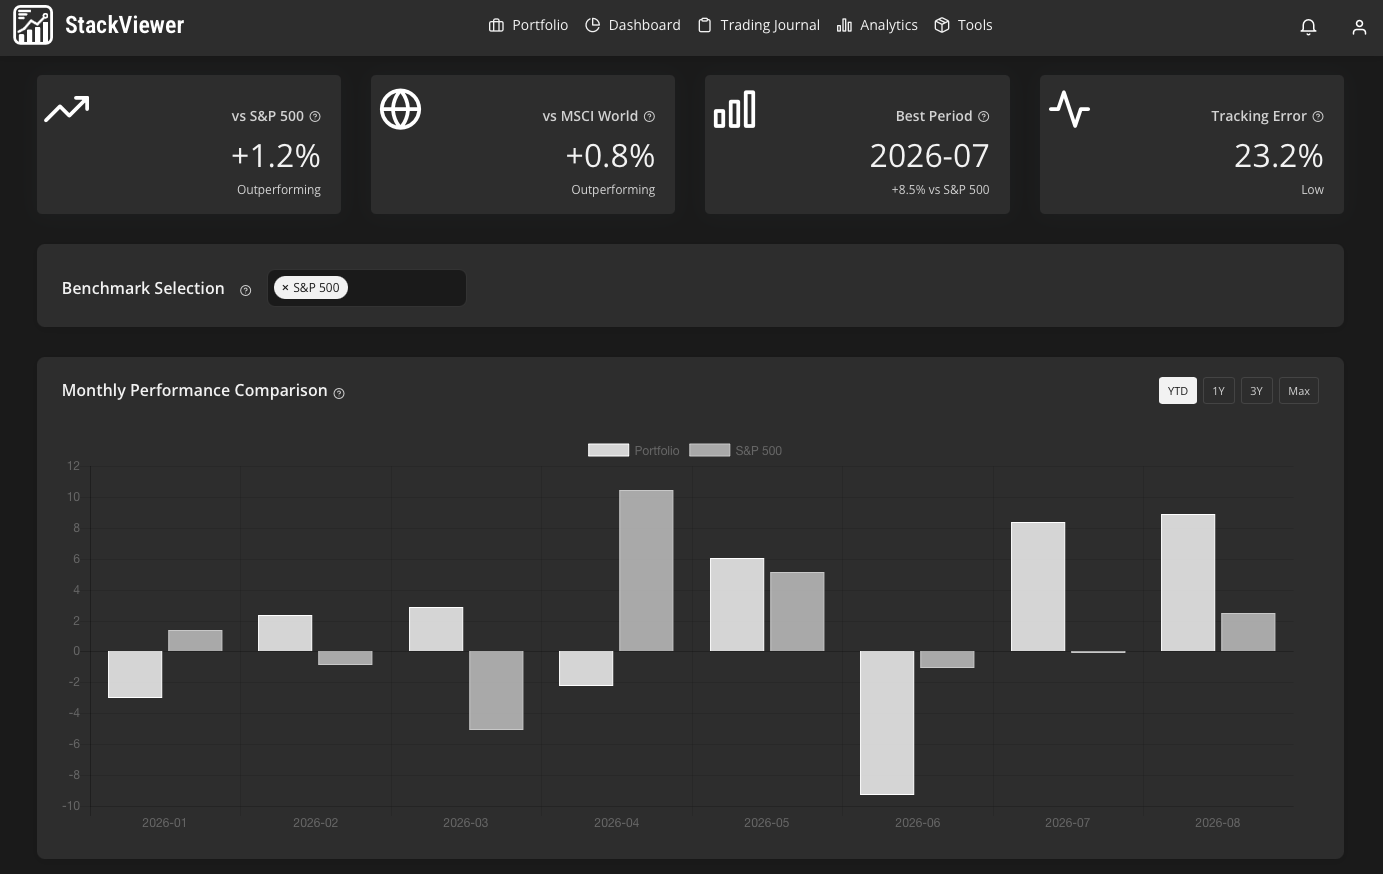
Hedge-fund metrics.
Honest answers.
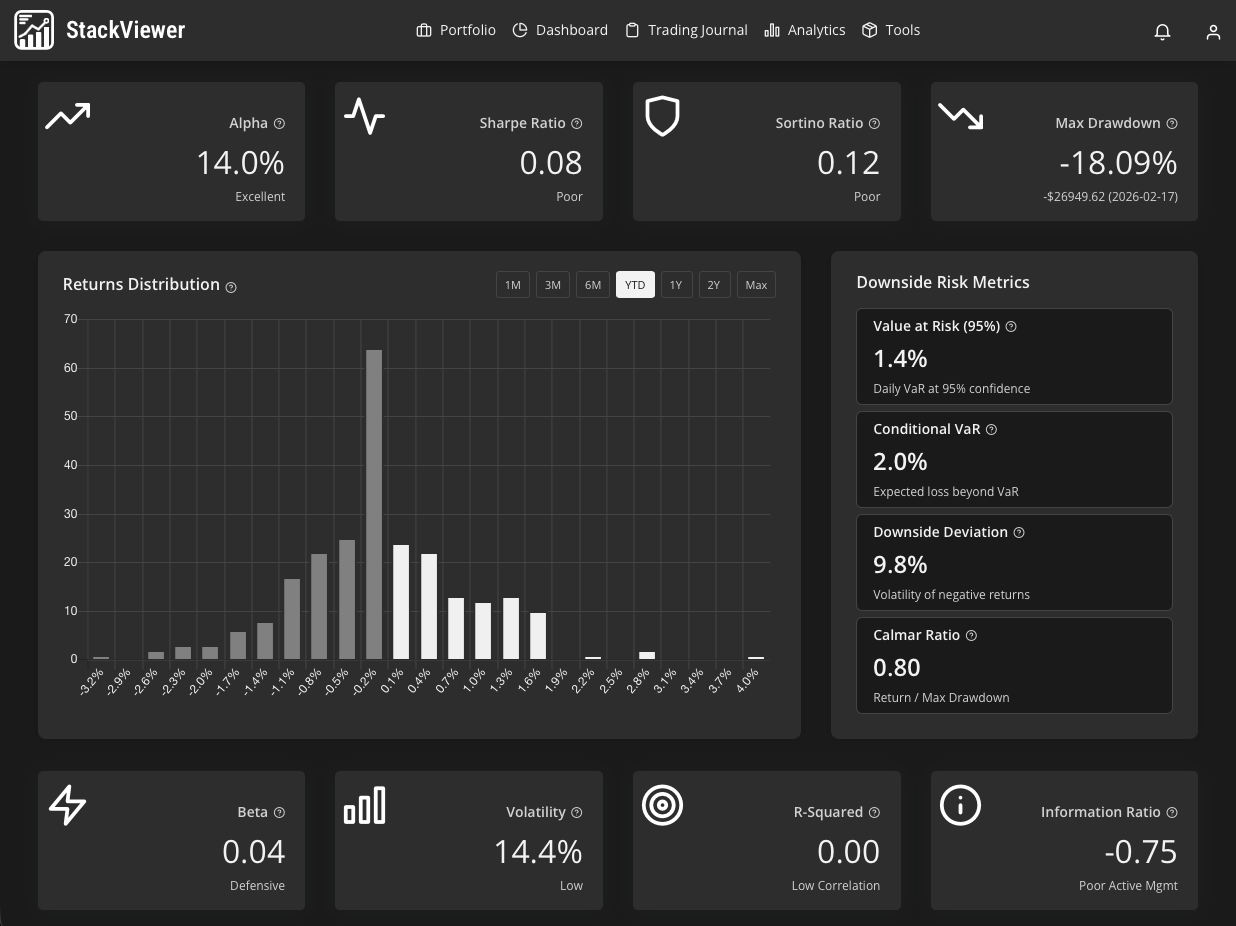
Sharpe, Sortino, Alpha, Beta, Max Drawdown, VaR — the same risk-adjusted metrics the pros use, put next to the market so you get a straight answer to the only question that counts: are you actually beating the index, or just riding it?
Write down the why.
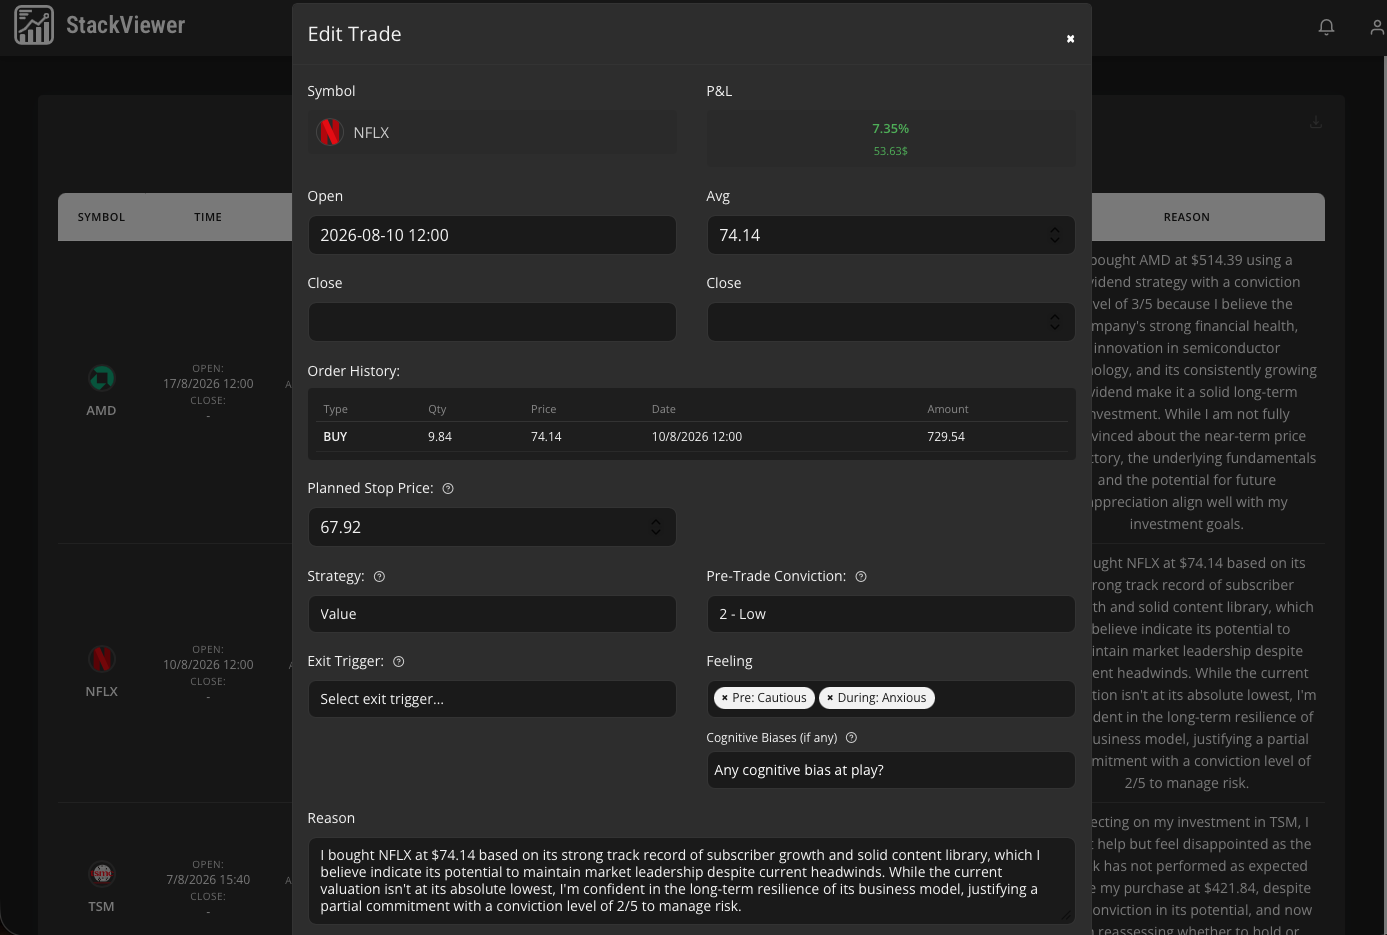
Watch the patterns appear.
Record your emotion, conviction, and rationale for each trade, then define the rules you're supposed to trade by. StackViewer scores every trade against your own playbook and shows you exactly where — and how often — you break your own rules.
See the risk
you can't feel.
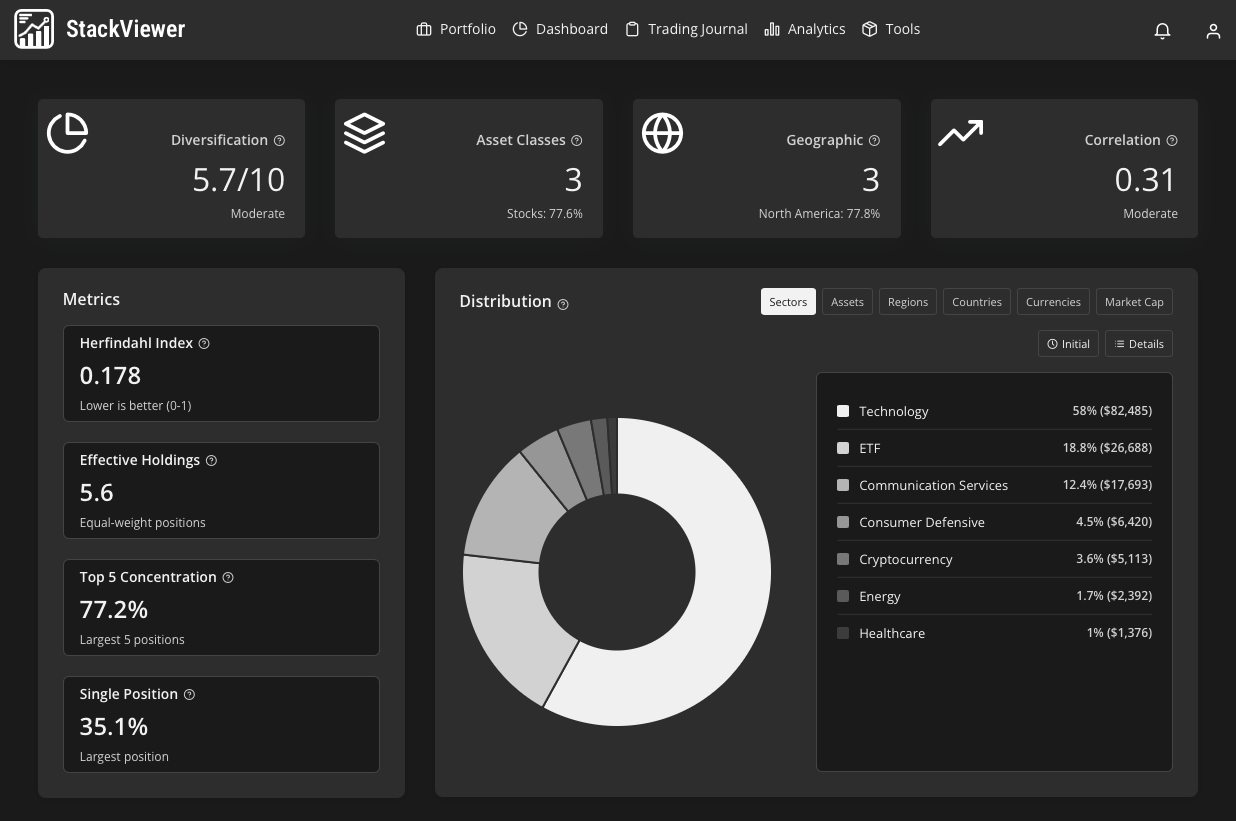
A portfolio can look balanced and still be dangerously concentrated. StackViewer breaks down your real exposure by sector, geography, asset class, and currency — then scores it, so over-concentration shows up before it costs you.
Know if you're
actually on track.
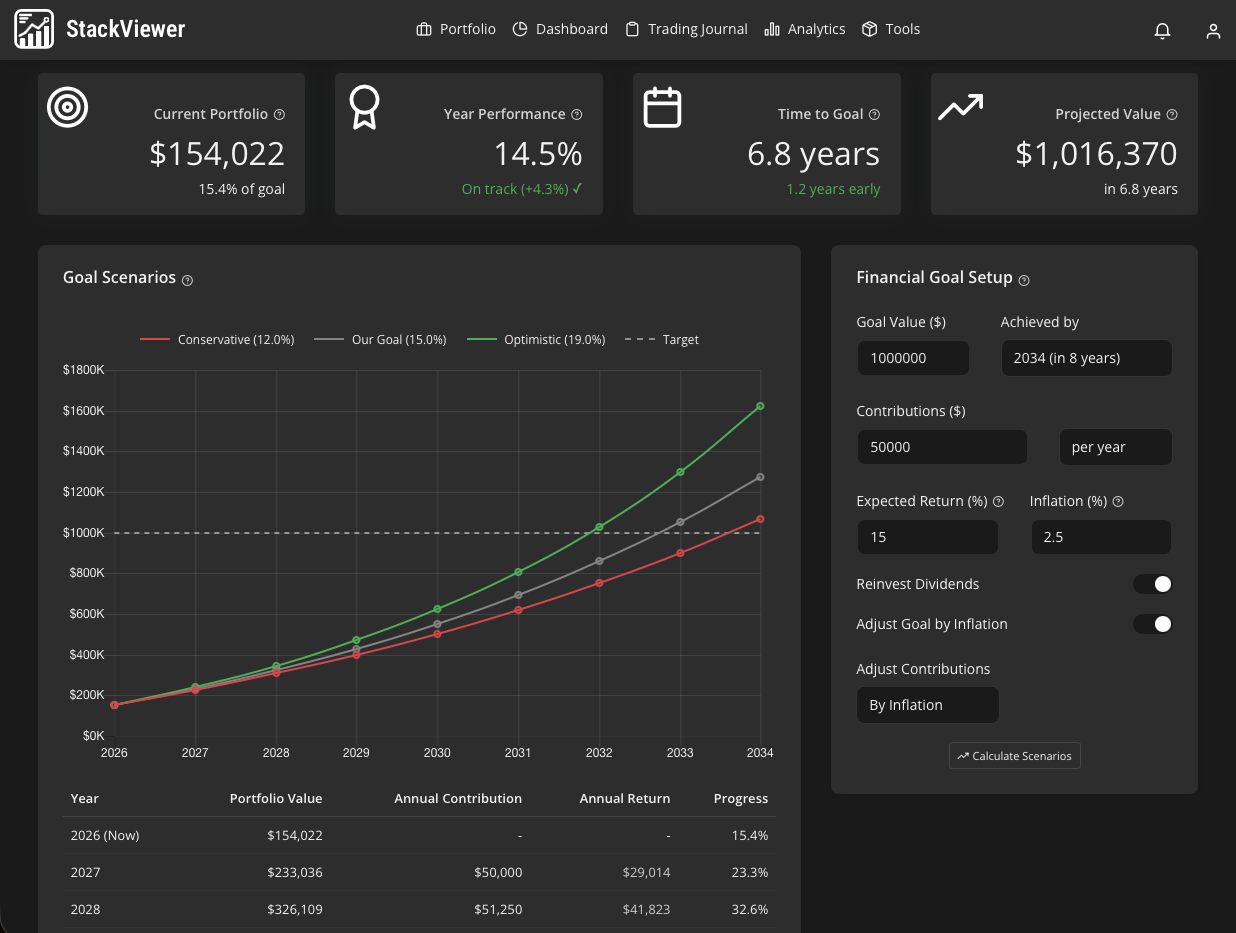
Set a target and StackViewer models whether you'll get there — running conservative, base, and optimistic scenarios with inflation and ongoing contributions factored in. No more guessing whether "someday" is realistic.
See your income
before it lands.
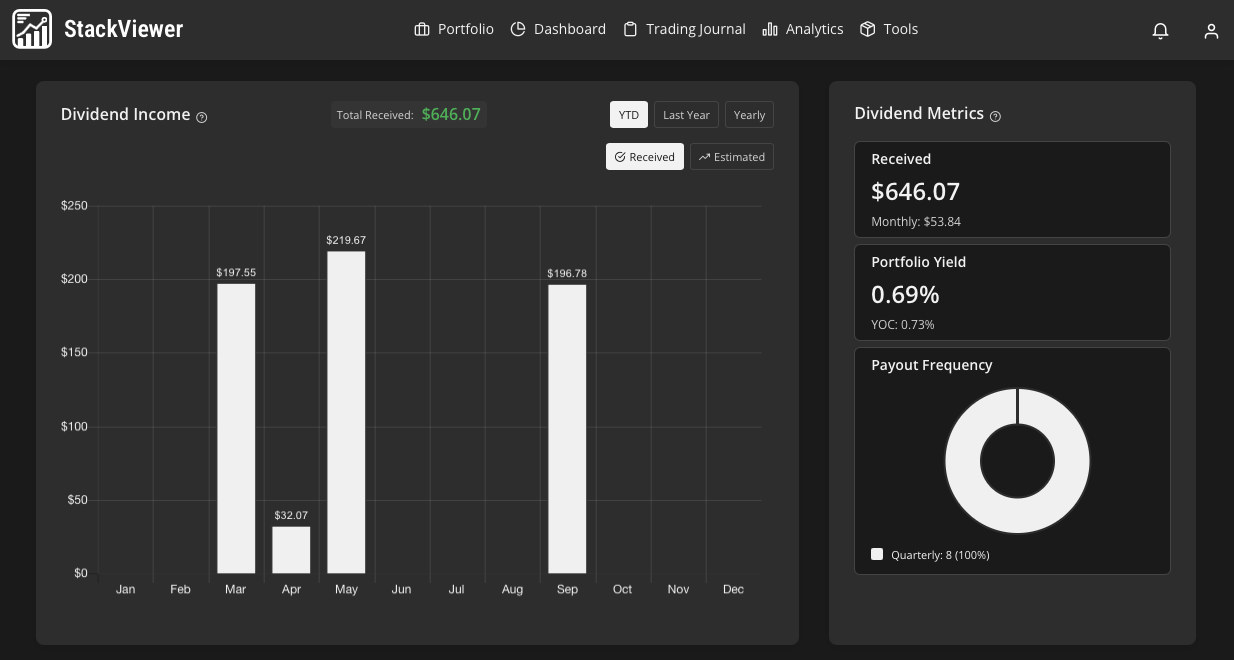
Every dividend across every account, in one calendar. Track what you've received and what's coming, see ex-dividend and payment dates, and watch your yield on cost grow — so your passive income stops being a guess.
Every position,
fully accounted for.
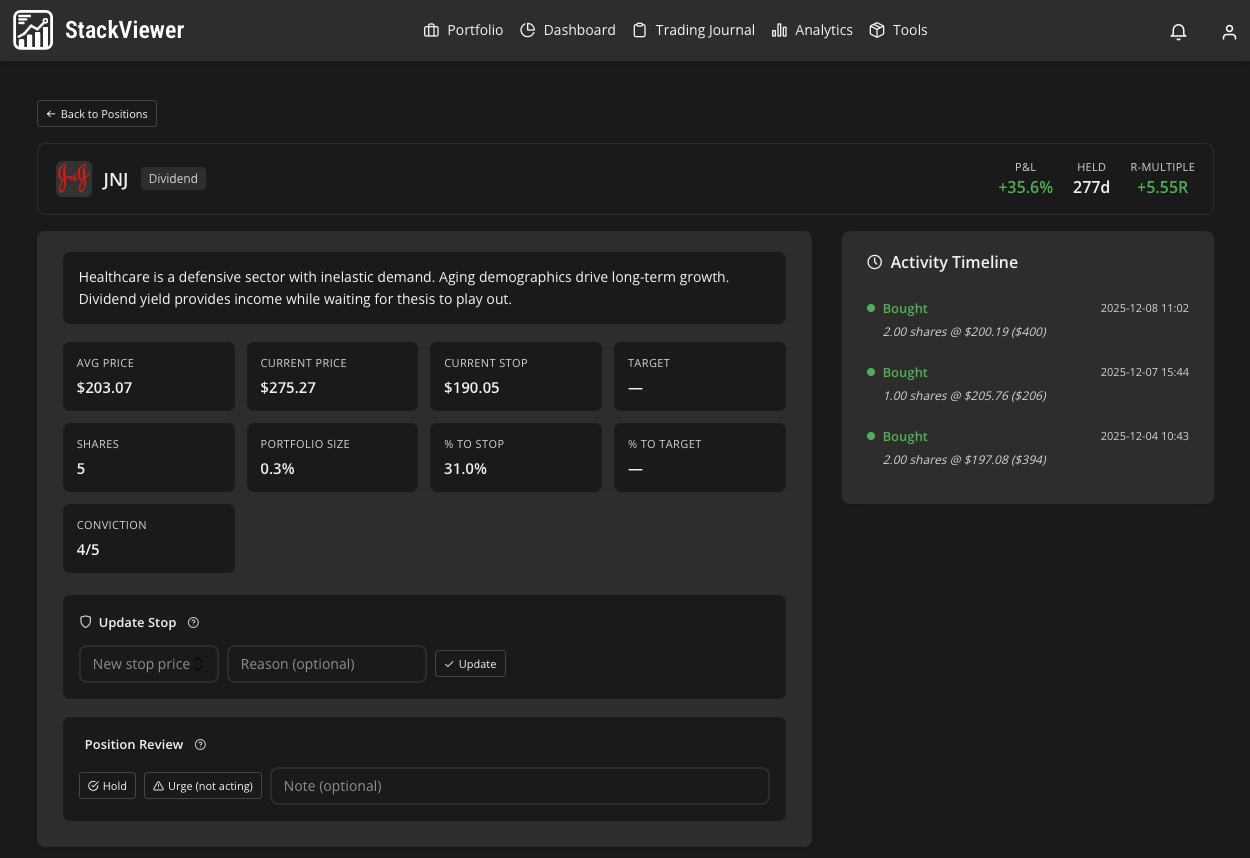
Drill into any holding and see the whole story — realized and unrealized P&L, R-multiple, days held, your conviction, stop and target, plus a complete timeline of every buy and sell. The context behind the number, not just the number.
Returns are easy.
Risk is the truth.
Anyone can post a big year. StackViewer shows what it cost you in risk — Sharpe, Sortino, Alpha, Beta, Max Drawdown, VaR, and volatility, tracked over time so you can see whether your edge is real or just a bull market.
Up and running in minutes
StackViewer is a retrospective analysis tool — you trade in your broker, we help you learn from it.
Connect your brokers
Link your brokerage accounts via secure read-only OAuth. We support Robinhood, Schwab, Fidelity, Coinbase, and 30+ brokers in total. We never touch your money.
Your data syncs automatically
Trades appear in StackViewer within 24 hours. Three daily sync cycles keep everything current, with market values refreshed throughout the day.
Journal your decisions
Add your emotions, conviction level, and rationale to each trade. The more context you add, the smarter the AI analysis becomes.
AI finds your patterns
StackViewer identifies what's working, what's not, and which cognitive biases are costing you the most — so you can fix them.
Ready to become a better investor?
Join investors who use data and self-reflection — not guesswork — to grow their portfolios.
No credit card required · Read-only broker access · Cancel anytime