Last reviewed 20 April 2026.
The short answer
A year-end investment checklist is the set of tasks you run each December to close out the year with a clear, accurate view of your money. If you hold two to four brokerage accounts, the essentials are: consolidate your true blended return, review tax lots for harvesting, total dividends and interest per account, run a rebalance and drift check, look for accidental duplicate exposure across brokers, reconcile cash and pending transfers, confirm your tax-advantaged contributions, review every closed trade, and refresh your playbook for next year. Do it in the first half of December — several of these steps have hard calendar deadlines, so leaving them to the last week leaves you no time to act.
You opened a second account for the fractional shares, a third for the cheap ETFs, and maybe a fourth for a pension or an ISA. Each one shows you a tidy little dashboard. None of them shows you your year, because none of them can see the others. So every December you end up in a spreadsheet at 11pm trying to add four YTD numbers together and wondering why the total feels wrong.
It feels wrong because it is wrong. Averaging the return figures four brokers hand you produces a number that means nothing — each broker weights differently, ignores your transfers, and stops counting at its own edge. This checklist fixes that, and eight other things, in an order you can actually work through. It is deliberately built to be re-dated and re-run every December, so keep it bookmarked.
Why year-end is harder with multiple brokers
A single-account investor has an easy December: their broker shows one return, one dividend total, one set of tax lots. Run two to four accounts and every one of those figures fragments. Your growth stocks might sit at Broker A, your index funds at Broker B, and your pension at Broker C — and the true story only appears when you stitch them together. Worse, the mistakes that cost money hide precisely in the gaps between accounts: the same S&P 500 fund bought in two places, a loss at one broker that would have offset a gain at another, a cash balance quietly sitting uninvested. No single dashboard is wrong, exactly; they are each just blind to two-thirds of your portfolio. Year-end is when that blindness becomes expensive, because tax decisions are made on the whole picture, not the slice.
The nine-item checklist, in order
Work through these top to bottom. The first four are time-sensitive; the last five are reflective and can spill into early January if you run out of afternoon. For each, the manual method comes first — you can do all of this with statements and a spreadsheet.
1. Consolidate your true, blended return. Do not average the four YTD percentages. Instead, compute a single money-weighted return (an internal rate of return) across all accounts. By hand: list every cash flow for the year — each deposit as a negative, each withdrawal as a positive, your 1 January total value as an opening outflow and your 31 December value as a closing inflow — then solve for the rate that makes them net to zero. In a spreadsheet, =XIRR(values, dates) does it. Worked example: you started at £80,000, added £500 on the 1st of each month, and finished at £91,300. XIRR returns roughly 7.9% — noticeably different from the simple "up £5,300 on £80k" (6.6%) that ignores when the money went in. That gap is why averaging broker numbers misleads.
2. Review your tax lots for harvesting. Pull the lot-level detail from each broker and list every position held at an unrealised loss, with its cost basis and holding period. Tax-loss harvesting means realising some of those losses to offset gains you have already booked. Two rules do the manual work for you: mind the wash-sale window (in the US, don’t rebuy a "substantially identical" security within 30 days either side), and check the loss is actually worth the spread and trading friction. Do this per broker, because a loss at one account can offset a gain realised at another.
3. Total dividends and interest per account. Add up every distribution — dividends, fund income, and cash interest — in each account separately. You want per-account totals because that is how the tax documents will arrive in the new year, and reconciling later is far easier if you captured the figure now while statements are fresh.
4. Run a rebalance and drift check. Write your target allocation (say 60% equities / 30% bonds / 10% cash), then compute the actual blended weights across all brokers combined. A sleeve that has drifted more than your tolerance band — commonly five percentage points — is a rebalance candidate. December is a sensible time because you can pair rebalancing trades with any harvesting from step two.
| Sleeve | Target vs actual (blended) | Action |
|---|---|---|
| Equities | 60% target / 68% actual | Trim 8 pts — overweight after a strong year |
| Bonds | 30% target / 24% actual | Top up 6 pts toward target |
| Cash | 10% target / 8% actual | Within band — leave it |
5. Check for accidental duplicate exposure. This one only exists for multi-broker investors. Line up holdings across every account and look for the same ticker bought in two places, or overlapping funds (a total-market ETF at Broker A and an S&P 500 fund at Broker B are ~85% the same companies). Add them up: you may be running a far larger single-name or single-index bet than you realised, simply because no one dashboard showed the combined position.
6. Review every closed trade of the year. Go back through each realised trade and, for each, write down three things: the reason you entered, your conviction at the time, and the emotion in play. This is the trading-journal half of the year and it is where most learning hides — the panic sell in a March dip, the FOMO buy at a top, the boring trade that quietly worked. Tagging them turns a year of decisions into a pattern you can name.
7. Reconcile cash and pending transfers. Confirm the cash balance each broker reports, chase any uncleared transfer between accounts, and check that corporate actions (splits, spin-offs, mergers) have landed correctly. Stray cash sitting uninvested across two accounts is a quiet drag; catch it now.
8. Confirm contributions and account limits. Check what you have paid into tax-advantaged accounts against the annual allowance, because most of these deadlines are fixed to the calendar and do not roll over. If you have headroom and the cash, December is your last practical chance to use it.
9. Refresh next year’s playbook. Using what steps one to six told you, write down the handful of rules you want to follow next year and the specific mistakes you want to stop repeating. Keep it short enough to actually read in January. This is the step everyone skips and the one that compounds.
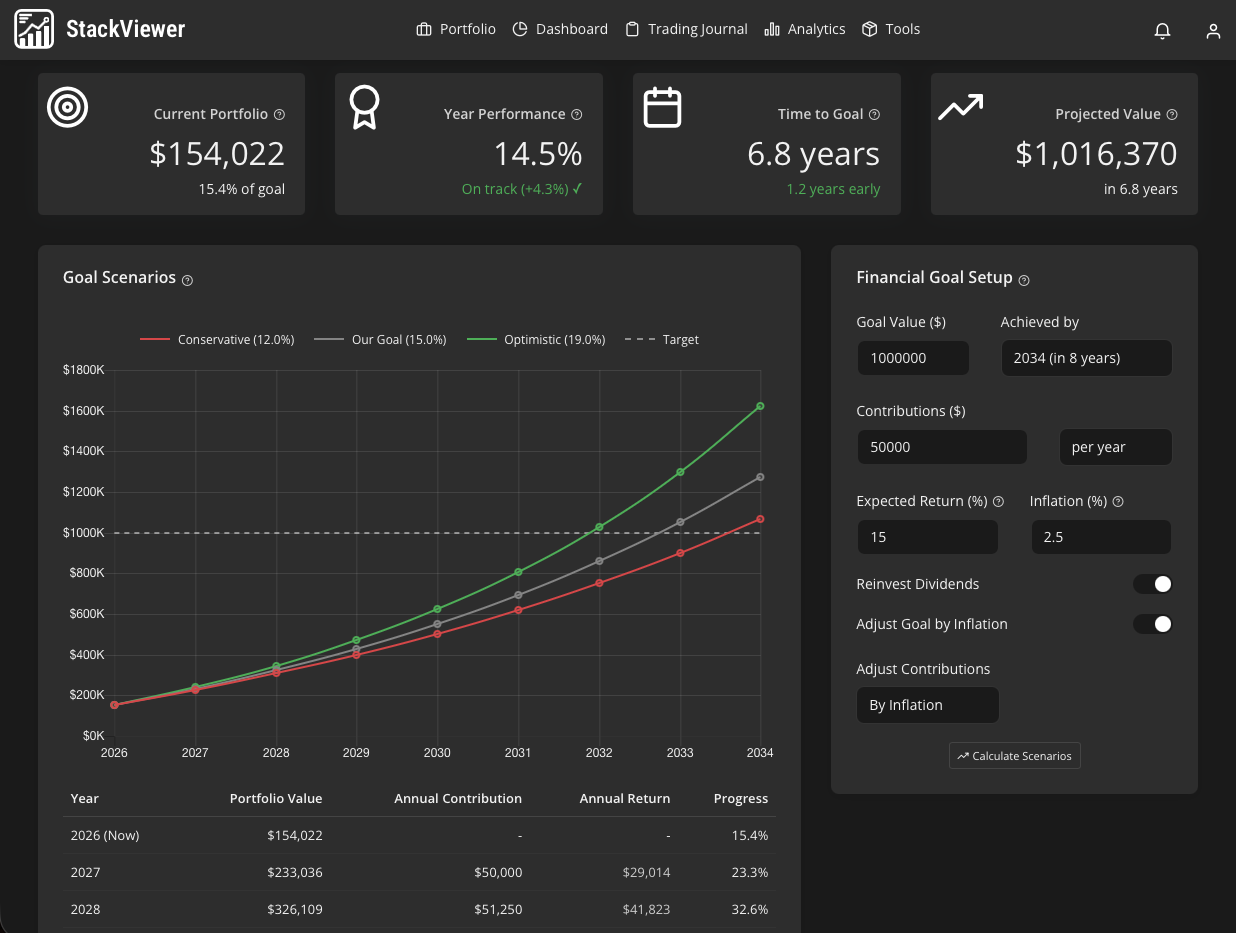
Steps one, four and five are the tedious ones by hand — that is exactly the maths StackViewer runs once your accounts are linked, blended return, drift and cross-broker overlap on one screen. See it on the live demo portfolio →
How to run it in an afternoon
The whole list takes an afternoon if you batch it. Download every account’s year-end statement and lot-level detail first, so you are not context-switching between logins mid-calculation. Do the four time-sensitive items (return, harvesting, dividends, rebalance) in one sitting so any resulting trades clear before the year closes, then take the reflective five — the trade review and playbook especially — more slowly, because rushing them defeats the point.
If you would rather not rebuild the spreadsheet every December, StackViewer connects up to 31 brokers through read-only OAuth via SnapTrade and does the stitching for you. It computes one blended, money-weighted return across all your linked accounts, totals dividends per account, flags allocation drift and duplicate exposure across brokers, and gives you 15+ risk metrics — Sharpe, Sortino, Alpha, Beta, Max Drawdown and Value at Risk among them — without you exporting a single CSV. For step six, the behavioural side, you tag each closed trade with a reason, a conviction level and an emotion, and the yearly pattern surfaces on its own. It is built for exactly the months-to-years investor this checklist is written for.
Whichever route you take, the value is the same: one true picture instead of four partial ones, produced before the deadlines rather than after.
What this doesn't tell you
Two honest caveats. First, this is a checklist, not tax advice — harvesting rules, contribution limits and wash-sale windows differ by country and by your personal situation, so treat the steps as prompts to check with a professional, not as instructions. Second, on the tooling: StackViewer syncs three times a day and refreshes values roughly every 30 minutes, so it is not real-time and is not built for day traders who need live prices — which for a once-a-year December review is a non-issue, but worth stating plainly. It reads accounts through SnapTrade’s 31 supported brokers, so an unsupported broker, some EU brokers, or custom and off-platform assets (private holdings, physical property, crypto held in a personal wallet) won’t appear and still need adding by hand. And it analyses decisions you have already made; it does not forecast returns or tell you what to buy.
Frequently asked
- When should I run a year-end investment checklist?
- Run it in December, ideally in the first half of the month. Loss harvesting and tax-advantaged contributions both have hard calendar deadlines, so leaving the checklist until the last week gives you no room to act on what you find.
- How do I calculate my real return across multiple brokers?
- You cannot simply average the return figures each broker shows, because each one only knows its own slice and computes returns differently. Combine all accounts into a single money-weighted (internal rate of return) calculation that accounts for the size and timing of every deposit and withdrawal across every broker.
Run the checklist without the spreadsheet
Link your brokers once and StackViewer keeps the blended return, dividends, drift and duplicate-exposure checks ready every December — and every day in between.
See the live demo or start freeNo credit card · Read-only broker access · Free forever plan

We build a portfolio tracker and trading journal for investors running two to four brokers on a months-to-years horizon. We write about the maths first and the product second.
This article is for information only. It is not financial, investment or tax advice, and nothing here is a recommendation to buy or sell any security. StackViewer analyses decisions you have already made; it does not predict returns. Past performance does not indicate future results.