Last reviewed 9 September 2026.
The short answer
Yield on cost is the annual dividend divided by the price you originally paid, so it rises mechanically every time the company raises its dividend — regardless of whether the stock is still a good place for your capital. It measures history, not opportunity. A holding can show a proud 8 percent yield on cost while yielding only 2 percent on its current market value, which means your capital is under-earning today. To decide whether to hold, ignore what you paid and compare the position's current yield against the opportunity cost of that capital.
If you hold dividend stocks, you have almost certainly said some version of this: “I bought this at $50 and it pays me $4 a share now — that’s an 8 percent yield on my cost.” It feels like the reward for patience. It gets posted in dividend forums with a green screenshot and a lot of upvotes. And it is real, in the narrow sense that you genuinely paid $50 and genuinely receive $4.
But here is the uncomfortable part, and the reason this piece will annoy some readers: yield on cost cannot help you decide whether to keep holding. It is anchored to a number — your purchase price — that stopped being relevant the moment the trade settled. The maths that makes yield on cost rise is the same maths that makes it useless for the only question that matters going forward. Let’s prove that, carefully, because if the arithmetic is loose the whole argument falls apart.
Why yield on cost climbs on its own
Yield on cost has a fixed denominator. You paid what you paid; that number never changes. The numerator — the annual dividend per share — only goes up if the company is a serial raiser. So a metric with a frozen bottom and a rising top has exactly one direction it can go: up. That is not a signal about quality or value. It is a definitional certainty. Any dividend-growth stock held long enough will show a high yield on cost, including one that has become badly overvalued, one whose growth has stalled, and one you should have sold years ago. The number rising tells you time has passed and dividends were raised. It tells you nothing else.
Compare that with current yield, which divides the same annual dividend by today’s market price. When a stock’s price runs far ahead of its dividend, current yield falls — and that fall is the honest signal that the shares now generate less income per dollar of capital tied up in them. Yield on cost hides that signal completely, because it refuses to look at the market price. Two investors holding the identical share today, one who bought at $50 and one who bought last week at $200, own exactly the same future cash flows and the same risk. Their yield on cost differs wildly. That alone should tell you the metric describes the buyer’s history, not the asset.
A worked example that shows the trap
Let’s do it by hand with clean numbers. Say you bought one share of a dividend grower at $50. In year one it paid $2.00 per share. Your yield on cost in year one equals current yield, because you had just bought it:
| Point in time | Dividend / share | Yield on cost ($50 base) |
|---|---|---|
| Year 1 (just bought, price $50) | $2.00 | 4.0% |
| Later (price now $200) | $4.00 | 8.0% |
| Same moment, current yield on $200 | $4.00 | 2.0% |
Over the holding period the dividend doubled from $2.00 to $4.00 and the share price quadrupled from $50 to $200. Your yield on cost is now $4.00 ÷ $50 = 8.0 percent, and it feels magnificent. But the current yield — the income the capital actually produces at its present value — is $4.00 ÷ $200 = 2.0 percent. Those two numbers describe the same share on the same day. The 8 percent is a monument to a decision you made years ago. The 2 percent is the truth about what that $200 of capital earns for you right now.
This is the trap in one line: yield on cost anchors you to a sunk cost. The $50 is gone; it is not the value of anything you own. What you own is a share worth $200 that throws off $4 a year. If a friend handed you $200 in cash today and asked where to put it, you would not accept 2 percent just because a spreadsheet remembers you once paid $50. Yet that is exactly the reasoning “my yield on cost is 8 percent” smuggles in.
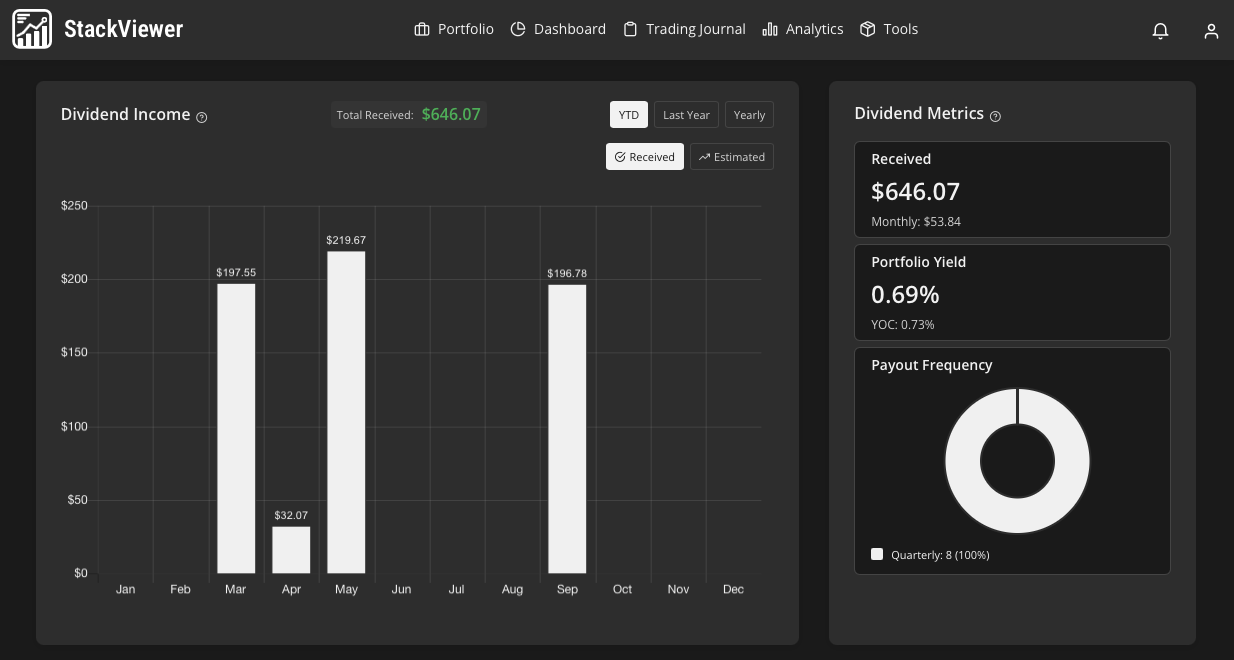
If you want to see current yield and yield on cost side by side across a real multi-broker portfolio instead of one share, that comparison is built into the dividends view. See it on the live demo portfolio →
What to look at instead: current yield vs opportunity cost
The honest replacement for yield on cost is a two-step comparison. First, work out the current yield on the position’s present market value — in the example, 2 percent on $200. Second, weigh that against the opportunity cost of the capital: the yield and total return you could reasonably get by redeploying that same $200 somewhere of comparable risk. This is not a call to sell winners. It is a call to make the hold-or-sell decision on today’s numbers rather than a flattering memory.
Make it concrete. Your share is worth $200 and pays $4 a year (2 percent). Suppose a comparable-risk holding — another quality dividend payer, or a broad income fund — currently yields 4 percent. If you sold and redeployed the $200, you would collect roughly $8 a year instead of $4. That is a real, quantified opportunity cost of $4 per year per share, and yield on cost never once puts it in front of you. Now, there are excellent reasons you might still hold: tax on the capital gain, the grower’s future dividend growth rate, quality and durability of the business, or simply that the 4 percent alternative carries more risk than it looks. The point is not that switching is correct. The point is that this is the calculation you should actually be running — and yield on cost is not an input to it.
Total return matters here too, so be fair to the bulls. A stock that quadrupled while doubling its dividend was, in hindsight, a superb hold; the paper gain is genuine and the growth may well continue. Nothing above says otherwise. What it says is narrower and harder to dodge: the past return is banked and irreversible, and it cannot justify a future decision. Whether the position deserves the next dollar of your capital depends on its forward current yield, its expected growth, and what else is on the table — the same lens you would apply to diversification and position sizing across the whole book.
What this doesn't tell you
This article deliberately simplifies. It ignores taxes, which can make selling a large long-term gain expensive enough to justify holding a lower current yield — run your own numbers, ideally with an accountant. It sets aside the dividend growth rate, which genuinely favours some “low current yield” growers over higher-yielding but stagnant payers; a 2 percent yield growing 10 percent a year is a different animal from a static 4 percent. And StackViewer itself is a portfolio tracker and trading journal for people investing over months and years, not a real-time terminal or an advice engine: it syncs three times a day with values refreshing roughly every 30 minutes, so it is not for day traders, it excludes custom or unlisted assets, and coverage of some EU brokers is limited. It shows you current yield, yield on cost and the income your capital actually produces — it does not tell you whether to sell, and it never predicts returns.
Frequently asked
- Is yield on cost a useless metric?
- It is not useless as a record of how a position has performed for you over time, and it feels good because it climbs. But it is useless for deciding whether to keep holding, because it is anchored to a purchase price that is now a sunk cost. Any decision about the future should compare the position’s current yield and total-return prospects against what else that capital could earn today.
- What should I look at instead of yield on cost?
- Look at the current yield on the position’s present market value, then weigh it against the opportunity cost of that capital, meaning the yield and expected total return you could get by redeploying it elsewhere. If a stock now yields 2 percent on its market price while a comparable-risk alternative yields 4 percent, your high yield on cost does not change the fact that the capital is under-earning today.
See current yield and yield on cost side by side
The demo portfolio shows both numbers for every holding across multiple brokers, so you can judge positions on what they earn today — not on what you paid.
See the live demo or start freeNo credit card · Read-only broker access · Free forever plan

We build a portfolio tracker and trading journal for long-horizon investors running two to four brokers. We write about the metrics investors actually use — and the ones that quietly mislead them.
This article is for information only. It is not financial, investment or tax advice, and nothing here is a recommendation to buy or sell any security. StackViewer analyses decisions you have already made; it does not predict returns. Past performance does not indicate future results.