Last reviewed 18 June 2026.
The short answer
For most individual investors, owning roughly 20 to 30 individual stocks captures almost all of the diversification benefit you can get from simply adding names. Below about 15 holdings you carry a lot of company-specific risk; beyond about 40 the extra risk reduction is tiny and mostly cosmetic. But the count is only half the story: 25 stocks spread across sectors and regions is far more diversified than 25 correlated megacap US tech names. The honest test is not "how many do I own?" but "how much of my outcome rides on a single company, sector, or currency?"
If you have ever counted the tickers in your account and wondered whether it is enough — or whether you have quietly accumulated too many — you are asking the right question in slightly the wrong units. "How many stocks should I own?" feels like it should have a single number attached. It doesn't, but it has something better: a well-understood curve that tells you exactly where the payoff from adding names flattens out.
This piece walks through that curve by hand, gives you concrete thresholds for different portfolio sizes, and then explains the trap almost everyone falls into — treating a raw count as if it measured diversification, when two portfolios with the same number of stocks can have wildly different real exposure. By the end you will be able to look at your own holdings and judge, roughly, whether they are too concentrated, about right, or spread so thin they have become a closet index fund.
The maths: why 15 to 30 is the sweet spot
Start with what diversification actually reduces. Every stock carries two kinds of risk. The first is systematic (market) risk — the part that moves with the whole market and cannot be diversified away. The second is idiosyncratic (company-specific) risk — a product recall, a fraud, a failed drug trial, a founder scandal. Diversification only touches the second kind. Adding stocks cannot protect you from a market-wide crash; it can protect you from any one company being the reason your year is ruined.
Here is the key mechanism, done by hand. Suppose every stock has the same total volatility and your holdings are only partially correlated with each other. Portfolio variance falls roughly in proportion to the average correlation plus the leftover company-specific variance divided by the number of holdings (N). That second term — the diversifiable part — shrinks as 1/N. And 1/N is a curve that drops steeply at first and then crawls.
Watch what 1/N does. Going from 1 stock to 2 removes half of the diversifiable risk. Going from 2 to 4 removes half of what's left. By 10 holdings you have eliminated about 90% of the diversifiable risk; by 20 holdings, roughly 95%; by 30, around 97%. That is the entire argument in one sentence: the benefit of each new stock is worth less than the one before it, and it fades fast.
This is why the difference between a 14-stock and a 15-stock portfolio is meaningful, while the difference between a 39-stock and a 40-stock portfolio is essentially noise. The 15th holding is still buying you a visible slice of risk reduction. The 40th is buying you a rounding error — and charging you a real cost in attention, transaction friction, and the growing chance that it overlaps something you already own.
| Number of holdings (N) | Diversifiable risk removed (approx.) | Marginal benefit of the next stock |
|---|---|---|
| 1 | 0% | — |
| 5 | ~80% | Large |
| 15 | ~93% | Still worthwhile |
| 20 | ~95% | Small |
| 30 | ~97% | Marginal |
| 40 | ~97.5% | Negligible |
These figures assume roughly equal weights and typical partial correlation between stocks; your own numbers move around depending on how correlated your holdings actually are. But the shape never changes, and the shape is the point.
Practical thresholds by portfolio size
The curve above tells you the ceiling of the useful range. Where you sit inside it depends on how much money is at stake and how much you can realistically follow. A few rules of thumb that hold up well for the months-to-years investor:
Under £10,000 / €12,000 / $13,000: Concentration is less dangerous here than paralysis and cost. 8 to 15 well-chosen positions, or a single broad index fund plus a handful of conviction picks, is plenty. Trying to hold 30 names at this size means tiny slivers that move the needle on nothing and cost you in fractional-share friction and attention.
£10,000–£100,000: This is the classic range for 15 to 25 individual holdings if you are picking stocks directly. It is enough to strip out most single-company risk while remaining small enough that you can actually know why each position exists. If you cannot write one honest sentence on the thesis for a holding, it probably shouldn't be there.
Above £100,000: More capital does not mean you need more names — the 1/N curve doesn't care how many pounds sit behind each stock. It means position sizing and overlap matter more, because a single 25% position is now a large absolute sum. Most investors at this level are well served by 20 to 30 direct holdings, or fewer stocks plus funds for the parts of the market they don't want to research.
Two guardrails cut across every size. First, watch your largest single position: once one name is more than 15–20% of the portfolio, your outcome is effectively a bet on that company regardless of how many others you own. Second, watch your top-five weight: if the biggest five holdings are more than about half the portfolio, you are concentrated in practice even if your count looks respectable.
Want to see your own largest-position and top-five weights without adding them up by hand? See it on the live demo portfolio →
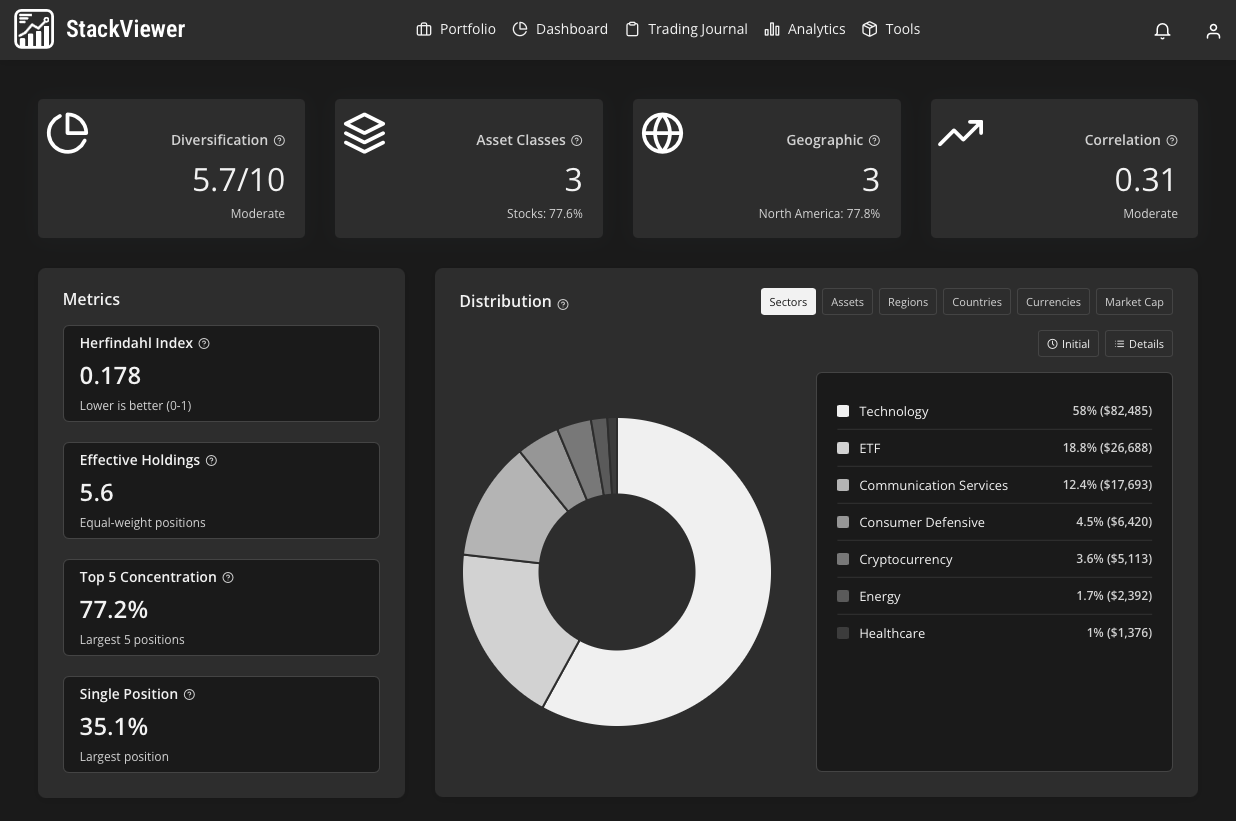
What a position count hides: sector and geography overlap
Here is where most people go wrong. A count treats every stock as an independent bet, but real portfolios are riddled with hidden correlation. Owning 30 stocks feels diversified. Owning 30 stocks where 12 are US large-cap technology, five are semiconductors, and three are the same theme via different tickers is not diversified — it is one concentrated bet wearing 30 name tags.
The 1/N maths only delivers its promised risk reduction when your holdings are genuinely different. As average correlation between your stocks rises toward 1, the diversifiable term stops shrinking — you can add names all day and the portfolio behaves like a single position. This is why sector and geography overlap quietly undoes a count that looks healthy on paper.
Three overlaps to check by hand. Sector concentration: add up the weight of your single largest sector; if one sector is more than a third of the book, that is your real risk, not your ticker count. Geographic and currency concentration: a portfolio of 25 US-listed stocks is a 100% dollar bet, whatever the company names say — fine if intentional, dangerous if unnoticed. Factor and theme overlap: several "different" holdings can all be the same trade (rate-sensitive growth, or a single supply chain) so that they rise and fall together in exactly the moment you needed them not to.
The practical fix is to score concentration on exposure, not on count. Look at largest position, top-five weight, largest sector weight, and home-country weight together. A portfolio that passes all four is diversified; one that fails any of them is concentrated no matter how many lines the statement runs to. If you want the mechanics of position-level concentration in more depth, see our guide to measuring portfolio concentration risk, and StackViewer computes the same figure across every account you connect.
This is exactly the gap StackViewer is built to close. Because it reads your holdings across up to four brokers through read-only OAuth, it can roll up your true sector, geography, and single-name exposure across accounts — the overlaps you cannot see when each broker shows you only its own slice. It reports a diversification and concentration view alongside 15+ risk metrics, so "how concentrated am I?" becomes a number you can act on rather than a hunch.
What this doesn't tell you
Two honest limitations. First, no count or score can tell you the right level of concentration for you — a high-conviction investor who follows a handful of businesses closely may rationally run a concentrated book, and this article is not a recommendation to spread out or pare down. Second, StackViewer is a tracker and journal for months-to-years investors, not a real-time trading tool. Holdings sync three times a day and values refresh roughly every 30 minutes, so the concentration figures reflect your positions as of the last sync, not the live tick. It also cannot see assets it does not support — custom or private holdings, some EU brokers, and non-connected accounts sit outside the score, which means your true exposure may be more concentrated than the app shows if a large holding lives somewhere it can't read.
Frequently asked
- How many stocks should I own to be diversified?
- For most individual investors, 20 to 30 individual stocks captures the great majority of the diversification benefit available from adding names. Below about 15 you carry meaningful company-specific risk; beyond about 40 the marginal reduction in that risk is tiny and mostly cosmetic. The right number also depends on how correlated your holdings are: 25 stocks spread across sectors and regions is far more diversified than 25 megacap US technology names.
- Is owning too many stocks a problem?
- It can be. Past roughly 40 holdings you gain almost no additional risk reduction, but you take on real monitoring cost, higher odds of accidental sector overlap, and a portfolio that quietly tracks the index while feeling like active management. This is sometimes called diworsification. If you cannot state why each position exists, that is usually a sign you own more names than you can actually follow.
See your real concentration across every broker
StackViewer rolls up your largest position, top-five weight, and true sector and geography exposure across up to four brokers — alongside 15+ risk metrics. Try it on the live demo portfolio, no signup needed.
See the live demo or start freeNo credit card · Read-only broker access · Free forever plan

We build portfolio-tracking and trading-journal tools for long-term investors running two to four brokers. We write about the maths behind good decisions — and the limits of any tool, including ours.
This article is for information only. It is not financial, investment or tax advice, and nothing here is a recommendation to buy or sell any security. StackViewer analyses decisions you have already made; it does not predict returns. Past performance does not indicate future results.