Last reviewed 24 February 2026.
The short answer
The Sharpe ratio measures return per unit of total volatility; the Sortino ratio measures return per unit of downside volatility only. For a long-term retail investor — especially anyone holding a few concentrated winners — Sortino is usually the more honest number, because Sharpe treats a violent up-month as "risk" and drags your score down for making money. Watch Sortino when you want to know how badly a strategy can hurt you, and keep Sharpe alongside it to compare against funds and benchmarks that only publish Sharpe. Neither is a verdict on your own portfolio — they are context, not advice.
You have probably seen both numbers on a fund fact sheet or a portfolio dashboard and quietly wondered whether they mean the same thing. They do not. They come from the same idea — how much return did you earn for the risk you took — but they define "risk" differently, and that single difference changes which strategies look good and which look reckless. If you hold two or three high-conviction positions that occasionally jump 8% in a month, the choice between them is not academic: one ratio will quietly penalise you for those jumps, and the other will not.
This piece writes out both formulas, applies them to the same twelve months of returns so the two numbers sit next to each other, and gives you interpretation bands you can actually use. It also covers the one input almost every explainer skips — the risk-free rate — because getting it wrong is the most common way retail investors quote a Sharpe or Sortino figure that is simply not comparable to anyone else's.
The two formulas, written out
Both ratios share the same numerator: your excess return, meaning the return you earned above a risk-free rate. Where they part company is the denominator. The Sharpe ratio divides excess return by the standard deviation of all your returns. The Sortino ratio divides the same excess return by the downside deviation — the standard deviation calculated using only the periods where you fell below a target (usually the risk-free rate or zero). In symbols:
Sharpe = (Rp − Rf) ÷ σtotal
Sortino = (Rp − Rf) ÷ σdownside
Here Rp is your portfolio return, Rf is the risk-free rate, and σ is the relevant standard deviation. Downside deviation is built by taking every period where the return was below the target, squaring the shortfall, averaging those squared shortfalls across the total number of periods (not just the negative ones — this is the convention most textbooks use), and taking the square root. Periods where you beat the target contribute a zero, not a positive number. That is the whole trick: Sortino simply refuses to count your good months as risk.
The risk-free rate: the input everyone skips
The numerator subtracts Rf, and your choice here moves both ratios. Use a short-term government instrument in the currency your portfolio is actually denominated in: the 3-month US Treasury bill yield for a dollar portfolio, the 3-month gilt for sterling, the 3-month bund or equivalent for euros. Convert the annual rate to match your data frequency — if you are working with monthly returns, divide the annual risk-free rate by twelve before subtracting it from each month. In our worked example below we use 4% annualised, which is 0.33% a month. Had we used 0% instead, the Sharpe ratio would rise noticeably, because you would no longer be giving away that "free" return. Always state the rate you used; a Sharpe ratio quoted without its risk-free rate is not comparable to anyone else's.
One portfolio, both ratios, side by side
Take a concentrated growth portfolio with these twelve monthly returns, in per cent: +4.2, −1.8, +6.5, +2.1, −3.4, +8.9, +1.2, −2.6, +5.4, +0.8, −1.1, +7.3. This is a deliberately lumpy year — big up-months, a handful of shallow down-months. It is what a portfolio of two or three winners often looks like.
Working by hand: the average monthly return is 2.29%, which annualises to roughly 27.5%. The standard deviation of all twelve returns is 4.13% a month, or about 14.3% annualised. With a 4% annual risk-free rate (0.33% a month), the average monthly excess return is 1.96%. Annualising the Sharpe ratio by multiplying by the square root of 12:
Sharpe = (1.96% ÷ 4.13%) × √12 ≈ 1.64
Now the Sortino. Only four months fell below the 0.33% monthly target: −1.8, −3.4, −2.6 and −1.1. Squaring each shortfall, averaging across all twelve months, and taking the square root gives a downside deviation of 1.56% a month (about 5.4% annualised) — far smaller than the 4.13% total, because eight of the twelve months contributed a zero. Dividing the same excess return by this smaller denominator and annualising:
Sortino = (1.96% ÷ 1.56%) × √12 ≈ 4.35
| Input | Sharpe uses | Sortino uses |
|---|---|---|
| Excess return (annualised) | ~23.5% | ~23.5% |
| Risk measure (annualised) | 14.3% total volatility | 5.4% downside volatility |
| Months counted as "risk" | All 12 | Only the 4 below target |
| Resulting ratio | 1.64 | 4.35 |
Notice how far apart the two numbers are for the exact same portfolio. The gap of 1.64 versus 4.35 exists entirely because Sharpe counted the +8.9% and +7.3% months as "volatility" and inflated the denominator, while Sortino ignored them. That is the practical meaning of the phrase "Sharpe penalises upside volatility": a month where you made a lot of money makes your Sharpe ratio worse.
Interpretation bands
Rough rules of thumb — treat them as context, not grades. Because Sortino uses a smaller denominator, its bands sit higher than Sharpe's for the same quality of strategy.
| Reading | Sharpe (annualised) | Sortino (annualised) |
|---|---|---|
| Poor | Below 1.0 | Below 1.0 |
| Acceptable | 1.0 – 2.0 | 1.0 – 2.0 |
| Good | 2.0 – 3.0 | 2.0 – 3.0 |
| Excellent | Above 3.0 | Above 3.0 |
Do not read too much into a single year of data: twelve monthly observations is a thin sample, and both ratios are noisy at that length. Three years of monthly returns is a more defensible window.
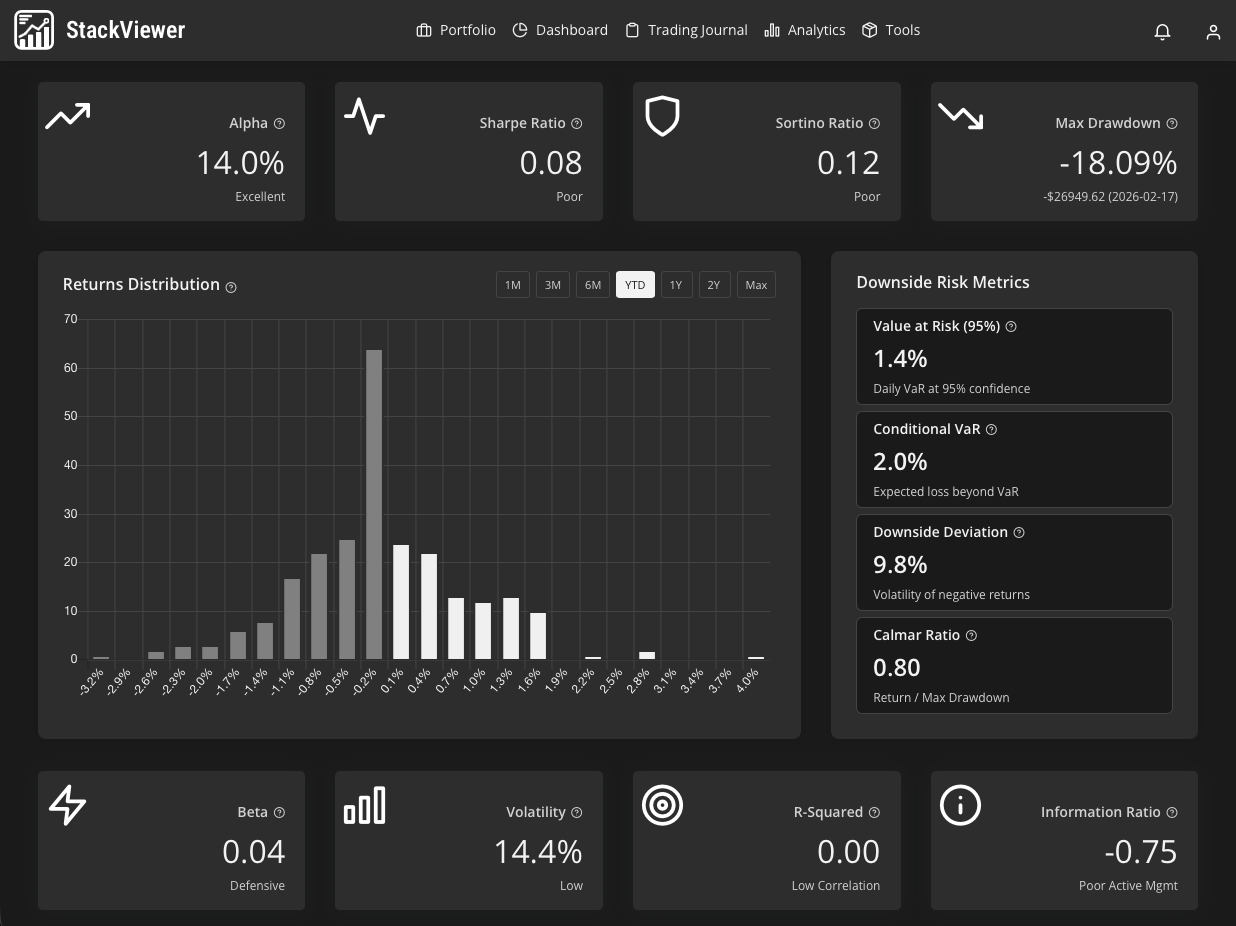
StackViewer calculates both ratios on your real holdings and shows the downside months it used, so you can see exactly why the two numbers differ. See it on the live demo portfolio →
Which one do I actually use?
If you hold a concentrated portfolio of high-conviction positions and you care about how far you could fall — which is what most long-term retail investors actually lose sleep over — watch Sortino. It answers the real question ("how much pain does this strategy inflict?") without punishing you for the up-months that are the entire point of holding a concentrated winner. A portfolio that is volatile mostly on the upside, like the worked example above, will look mediocre on Sharpe and strong on Sortino, and the Sortino reading is the fairer description of your experience.
Keep Sharpe alongside it for one blunt reason: it is the number everyone else publishes. Fund fact sheets, index comparisons and most robo-advisers quote Sharpe, so if you want to place your portfolio next to a benchmark or an ETF, you often have no choice but to compare Sharpe to Sharpe. Never compare your Sortino to someone else's Sharpe — they are different scales and the comparison is meaningless. The most useful habit is to watch both, and to treat the gap between them as information: a wide gap tells you most of your volatility is upside, which is usually a good problem to have. If you are still building the portfolio these ratios describe, our guide to diversification for retail investors covers how concentration and correlation feed into both figures, and our cornerstone on portfolio performance metrics puts Sharpe and Sortino in context with the other measures worth tracking.
What this doesn't tell you
Both ratios assume returns are reasonably well-behaved, and neither describes the shape of a genuine crash — a single catastrophic month can wreck a portfolio while barely moving a ratio calculated over years. They also depend heavily on your measurement window and frequency; the same portfolio can post very different ratios over one year versus three. StackViewer computes these on synced broker data that updates three times a day with values refreshing roughly every 30 minutes — it is not real-time, so the figures are not meant for day-trading decisions and will lag intraday moves. Custom or unlisted assets you hold outside a connected broker are excluded from the calculation, and coverage of some EU brokers is still partial, so a ratio here reflects only the accounts StackViewer can actually see. Finally, a strong Sortino is not a prediction: it describes decisions you have already made, not returns you are going to get.
Frequently asked
- Is a higher Sortino ratio always better than a higher Sharpe ratio?
- Not exactly — they are different scales, so you cannot compare a Sharpe of 1.6 with a Sortino of 4.3 as if they were the same measure. Compare Sharpe to Sharpe and Sortino to Sortino across portfolios. Sortino is almost always the higher of the two numbers for the same portfolio because it ignores upside volatility, so the gap between them tells you how much of your total volatility was actually gains rather than losses.
- What risk-free rate should a retail investor use for Sharpe and Sortino?
- Use a short-term government instrument in your base currency — the 3-month Treasury bill yield for USD portfolios, or the equivalent 3-month gilt or bund for GBP/EUR. Match the currency of your holdings and hold the rate roughly constant over the measurement window. The choice matters: a 0% versus 4% risk-free rate can swing a Sharpe ratio by 0.3 or more, so always state which rate you used when you quote a number.
See both ratios on a real portfolio
StackViewer calculates Sharpe, Sortino and 13 more risk metrics on your synced holdings, and shows the downside months behind every number so you can see why they differ.
See the live demo or start freeNo credit card · Read-only broker access · Free forever plan

We build a portfolio tracker and trading journal for long-term investors running two to four brokers. We write about the metrics and behavioural patterns that actually change how people invest — and we admit what the numbers can't tell you.
This article is for information only. It is not financial, investment or tax advice, and nothing here is a recommendation to buy or sell any security. StackViewer analyses decisions you have already made; it does not predict returns. Past performance does not indicate future results.