Last reviewed 6 May 2026.
The short answer
An R-multiple is your profit or loss on a position expressed in units of the risk you took at entry, where one unit — 1R — is the amount you decided you could lose. Day traders set 1R with a stop-loss; long-term investors set it a different way, usually as a fixed adverse move (say 20–25%), the distance to a thesis-invalidation level, or a flat slice of capital per position. Once 1R is fixed and written down at entry, a stock you sell for a +2R gain and one you sell for a +0.4R gain are directly comparable, no matter how long you held them. Average your R-multiples across closed positions and you get expectancy: the average return per unit of risk your process produces.
You have read about R-multiples on a day-trading forum or in a scalper's YouTube video, and it sounded genuinely useful — a clean way to score every trade against the risk you took, instead of just the dollars you made. Then came the catch: every explanation assumes you enter with a stop-loss order sitting two percent below your fill. You hold positions for nine months. You have never set a stop in your life, and you are not about to start. So you closed the tab and assumed R-multiples weren't for you.
They are. The stop-loss is not the point of R — it is just the day trader's convenient way of defining one number. That number, your initial risk unit, is something a buy-and-hold investor can define perfectly well without ever placing an order to sell. This article reclaims the metric for people who think in quarters and years. We will define R from scratch, solve the genuinely hard part (setting your risk unit with no hard stop), walk one position across a nine-month hold, and then compute expectancy from a sample of twenty closed trades.
What R actually is (and why holding period is irrelevant)
R stands for risk. One R is the amount of money you were prepared to lose on a position at the moment you opened it. Every other outcome is measured as a multiple of that unit. Lose exactly what you planned to lose and you took a −1R result. Make three times that amount and you booked a +3R winner. Scratch out for a tiny gain and you have a +0.2R. The dollar sizes disappear; what remains is a pure ratio between reward and the risk you consciously accepted.
This is why R-multiples are more honest than raw percentage returns. A +40% gain on a position you sized recklessly and a +40% gain on one you sized carefully look identical in a percentage column, but they are not the same decision. R normalises for how much you actually put on the line. It lets you compare a REIT you held for two years against a growth stock you held for four months on a single axis: how much reward did each decision return per unit of risk taken? Holding period never enters the formula. That is the whole reason the metric survives the jump from minutes to months intact.
The formula is simply:
R-multiple = (exit price − entry price) ÷ (initial risk per share)
Everything hinges on that denominator. Get the initial risk unit right and the rest is arithmetic.
| Scenario | Dollar profit | R-multiple |
|---|---|---|
| Sized so 1R = $2,520; sold for +$4,752 | +$4,752 | +1.9R |
| Same $4,752 gain, but 1R was only $1,000 | +$4,752 | +4.8R |
| Same $4,752 gain, but 1R was $5,000 | +$4,752 | +0.95R |
The middle rows make the point: identical profit, wildly different quality of decision. R sees what a percentage return hides.
Setting 1R when you don't use a hard stop
This is the part every day-trading tutorial skips, because for them it is trivial: 1R is the distance to the stop. For an investor who never places a stop, you have to define your risk unit deliberately. There are three defensible ways to do it, and you should pick one and stay consistent.
1. The fixed adverse-move method. Decide, at entry, the percentage drawdown that would represent a genuine loss of capital rather than ordinary volatility — commonly 20–25% for a single equity. If you buy 240 shares at $42.00 and treat a 25% decline as your risk line, then 1R per share is $10.50 and your total risk unit is $2,520. You are not promising to sell at −25%; you are simply naming the loss you would consider a full, planned-for hit to that position.
2. The thesis-invalidation method. Estimate the price at which your reason for owning the stock would be proven wrong — a broken growth story, a dividend cut, a debt covenant breach. The distance from your entry to that level is 1R. This is the most intellectually honest version because it ties risk to the actual investment case, but it requires you to write the thesis down clearly enough to know when it has failed.
3. The flat-capital method. Simplest of all: decide that every position risks the same fixed slice of your portfolio — say 2% of total capital — and let that dollar figure be 1R regardless of the individual name. This trades precision for consistency and works well if you struggle to estimate invalidation levels.
Whichever you choose, the two rules are the same: fix 1R before you buy, and never revise it after the fact to flatter a result. The moment you let a losing position quietly redefine its own risk unit, the metric becomes a story you tell yourself instead of a measurement.
A worked nine-month hold, then expectancy over 20 trades
Take a real-feeling example. In one financial year you buy 240 shares of a mid-cap at $42.00. You use the fixed adverse-move method and decide a 25% decline is your risk line, so:
- Risk per share (1R) = $42.00 × 25% = $10.50
- Total risk unit (1R) = $10.50 × 240 shares = $2,520
Nine months later the thesis has played out and you sell at $61.80. Your gain per share is $19.80, or $4,752 in total. To score it:
R-multiple = $19.80 ÷ $10.50 = +1.9R
The nine months of holding never touched the calculation. What matters is that you earned 1.9 units of reward for the one unit of risk you accepted at entry. Log that number the day you sell, alongside why you sold, and you now have a data point you can compare against every other exit — the short holds and the multi-year ones alike.
One trade tells you nothing. The power of R shows up when you have a sample. Suppose over a couple of years you close twenty positions and record each in R:
| Measure | Value | How it's derived |
|---|---|---|
| Positions closed | 20 | Sample size |
| Winners / losers | 12 / 8 | Trades above vs at-or-below 0R |
| Win rate | 60% | 12 ÷ 20 |
| Average winner | +1.96R | Mean of the 12 winning R-multiples |
| Average loser | −0.89R | Mean of the 8 losing R-multiples |
| Total R booked | +16.4R | Sum of all 20 R-multiples |
| Expectancy | +0.82R | 16.4R ÷ 20 trades |
Expectancy is the single most useful number here. It says that, on average, every unit of risk you put on the table returned about 0.82 units. You can reach the same figure with the classic formula — (win rate × average win) + (loss rate × average loss) = (0.60 × 1.96) + (0.40 × −0.89) = +0.82R — and it is worth noticing that your average loser came in below 1R. That means, on the whole, you cut losing theses before they hit your full planned risk. That discipline, not the win rate, is what makes the expectancy positive.
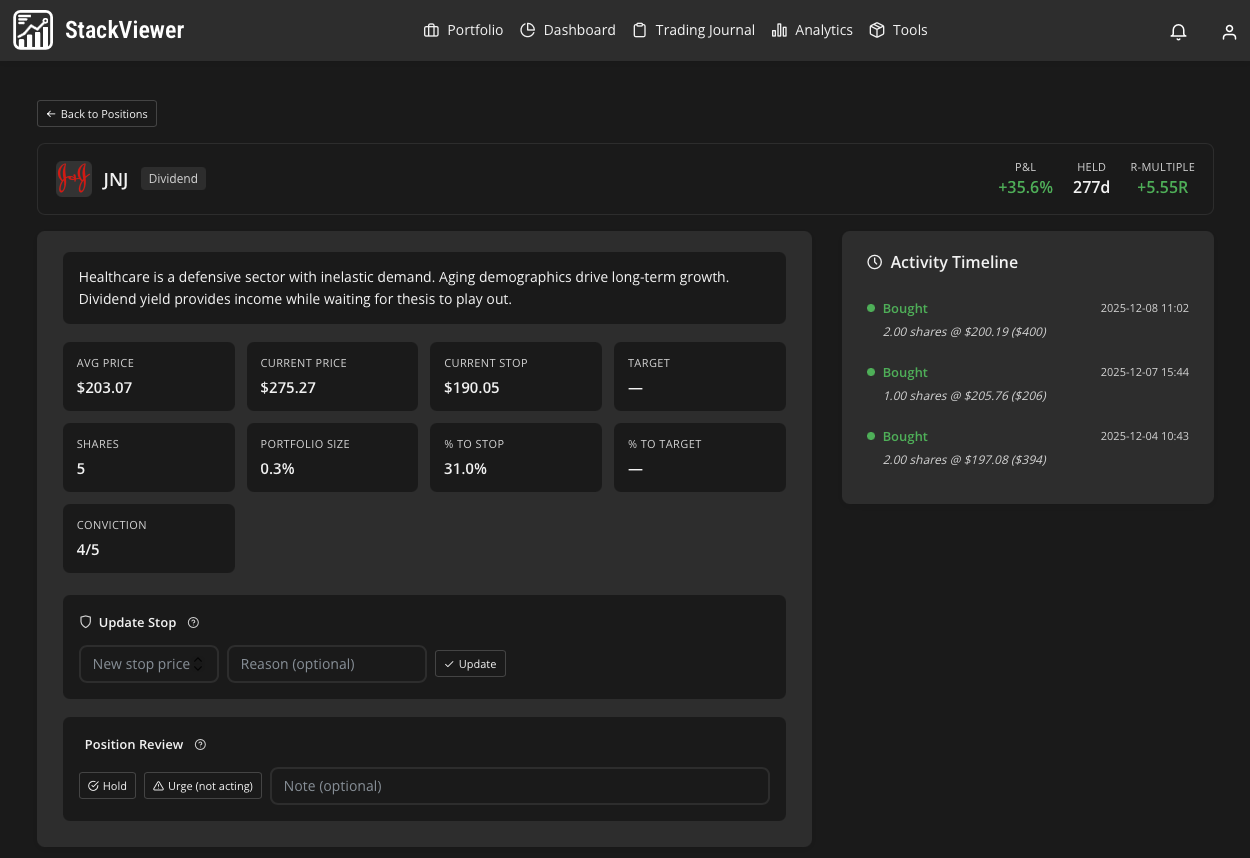
If you would rather not keep this ledger in a spreadsheet, StackViewer scores every closed position in R and rolls it into a live expectancy figure for you. See it on the live demo portfolio →
You can run the whole nine-month example yourself with our free R-multiple calculator — enter your entry, exit and risk unit and it returns the R-multiple and, across several trades, your expectancy. Pair it with a disciplined trading journal so that each R sits next to the reason you entered and exited, and the numbers start teaching you something about your own behaviour rather than just the market's.
What this doesn't tell you
R-multiples measure realised decisions, not open ones — a position you are still holding has no final R until you sell, and an unrealised +3R can round-trip to +0.5R while you wait. Expectancy is only as trustworthy as your sample: twenty trades is a starting point, not statistical certainty, and a single outsized winner can flatter the average, so read expectancy alongside win rate and average loss. The metric also says nothing about time. A +2R booked in three months and a +2R booked over three years score identically, yet the first tied up your capital far more efficiently; pair R with a return-per-year view before you conclude a slow winner was a good one. And none of this is advice about what to buy. R tells you how well you managed risk on decisions you already made — it cannot tell you which decision to make next.
Frequently asked
- Can you use R-multiple if you don't set a stop-loss?
- Yes. R is just your initial risk unit, and a hard stop is only one way to define it. Long-term investors can set 1R as the dollar amount they would treat as an unacceptable permanent loss on that position — for example a fixed 20–25% adverse move, the distance to a thesis-invalidation level, or a flat share of portfolio capital. Once 1R is fixed at entry and written down, every outcome can be scored in R even though you never place a stop order.
- What is a good R-multiple expectancy for a long-term investor?
- Any positive expectancy means your process makes money per unit of risk over a sample. In our 20-trade example the expectancy was +0.82R per position, meaning each unit of risk returned about 0.82 units on average. Because investors take far fewer positions than day traders, judge expectancy over years and a couple of dozen closed positions, not weeks. A single big winner can distort a small sample, so pair expectancy with win rate and average loss size before drawing conclusions.
See your own portfolio scored in R
StackViewer connects read-only to 31 brokers, tags every closed position with its R-multiple and reason for exit, and keeps a running expectancy figure across your whole history — no spreadsheet required.
See the live demo or start freeNo credit card · Read-only broker access · Free forever plan

We build a portfolio tracker and trading journal for investors who hold for months and years, running two to four brokers. We write about the risk and behavioural metrics that actually apply on that timescale.
This article is for information only. It is not financial, investment or tax advice, and nothing here is a recommendation to buy or sell any security. StackViewer analyses decisions you have already made; it does not predict returns. Past performance does not indicate future results.