Last reviewed 3 June 2026.
The short answer
Portfolio concentration risk is the danger that a handful of positions — or a handful of shared exposures — drive most of your outcome, so a single bad surprise hurts far more than you expect. You measure it with the Herfindahl-Hirschman Index (HHI): square each holding's weight, add the squares up, and read the result on a 0-to-1 scale where higher means more concentrated. As a rough guide, below 0.10 is diversified, 0.10-0.18 is moderate, and above 0.18 is concentrated. The catch most investors miss: you have to measure concentration at three levels — position, sector and factor — because a portfolio can look spread out by ticker while being one enormous bet underneath.
You can hold twenty different stocks and still be making, in effect, three or four bets. Most people who track their own portfolio count the number of tickers, glance at the biggest position, and conclude they are "reasonably diversified". That instinct is where concentration risk hides. It is the one form of risk you cannot feel day to day — the portfolio ticks along fine for years, right up until the day the thing you were quietly over-exposed to has a bad week.
The good news is that concentration is one of the few risks you can measure exactly, with arithmetic you already know, in the time it takes to make coffee. This piece walks through the maths by hand, gives you the thresholds that matter, and then — the part almost everyone skips — shows you why measuring concentration at the position level alone can lull you into a completely false sense of safety.
What the Herfindahl-Hirschman Index actually measures
The Herfindahl-Hirschman Index started life in economics as a way to measure how concentrated an industry is — whether one company dominates a market or many share it. Regulators still use it to decide whether a merger creates a monopoly. The same idea works beautifully for a portfolio: instead of market share by company, you use portfolio weight by holding.
The formula is deliberately simple. Take each holding's weight as a share of the whole portfolio, square it, and add all the squares together. Squaring is the trick that makes it useful: it punishes large weights disproportionately. A 20% position contributes 0.04 to the total, but a 5% position contributes only 0.0025 — sixteen times less — even though it is only four times larger. That means the index leans hard on your biggest bets, which is exactly what you want from a concentration measure.
You can express the result two ways, and both appear in the wild. On the decimal scale, weights are fractions (0.15 for 15%) and the index runs from near 0 to 1.0; a single-stock portfolio scores 1.0, and a perfectly equal 20-stock portfolio scores 0.05. On the "points" scale, weights are whole percentages (15 for 15%) and the index runs from near 0 to 10,000; the same single-stock portfolio scores 10,000. They are the same number multiplied by 10,000. The most human way to read it is to flip the decimal version upside down: 1 ÷ HHI gives the effective number of holdings — how many equally weighted positions your portfolio really behaves like.
| HHI (decimal) | HHI (points) | What it means |
|---|---|---|
| Below 0.10 | Below 1,000 | Broadly diversified — no single holding dominates. |
| 0.10 – 0.18 | 1,000 – 1,800 | Moderately concentrated — a few positions carry real weight. |
| Above 0.18 | Above 1,800 | Concentrated — fine if deliberate, dangerous if accidental. |
Treat those thresholds as guide rails, not verdicts. Warren Buffett runs a famously concentrated book on purpose and sleeps fine; an index-fund investor who wants nobody bet to matter will aim well below 0.10. The point of the number is not to pass or fail — it is to make sure a concentrated portfolio is a decision you made, not one that crept up on you while you were adding to your favourite name.
Working the HHI by hand on a 20-stock portfolio
Here is a realistic portfolio — twenty US large-cap holdings, the kind a long-term investor actually ends up with after a few years of buying quality names. On paper it looks well spread: twenty tickers, nothing obviously reckless. Watch what the arithmetic says.
Step one: list the weights (they sum to 100%). Step two: square each. Step three: add the squares. To keep the mental arithmetic clean we will use the points scale (whole percentages), then convert at the end.
| Holding | Weight (%) | Weight squared |
|---|---|---|
| Nvidia | 16 | 256 |
| Microsoft | 13 | 169 |
| Apple | 10 | 100 |
| Amazon | 8 | 64 |
| Alphabet | 7 | 49 |
| Meta | 6 | 36 |
| Broadcom | 5 | 25 |
| Eli Lilly | 4 | 16 |
| Visa | 4 | 16 |
| JPMorgan | 4 | 16 |
| Costco | 3 | 9 |
| UnitedHealth | 3 | 9 |
| Home Depot | 3 | 9 |
| Mastercard | 2 | 4 |
| ExxonMobil | 2 | 4 |
| Procter & Gamble | 2 | 4 |
| Coca-Cola | 2 | 4 |
| Caterpillar | 2 | 4 |
| Deere | 2 | 4 |
| NextEra | 2 | 4 |
| Total | 100 | 802 |
The squares add up to 802 on the points scale, which is 0.0802 in decimal. So far, so respectable — that sits inside the "broadly diversified" band. But now flip it over: 1 ÷ 0.0802 gives an effective number of holdings of about 12.5. You own twenty stocks, but the portfolio behaves like roughly twelve-and-a-half equally weighted ones. Nearly eight of your positions are, statistically, contributing almost nothing.
You can see why in the top of the table. The four biggest holdings — Nvidia, Microsoft, Apple and Amazon — account for 589 of the 802 total, meaning the top four names generate 73% of your entire concentration while the bottom sixteen share the remaining 27%. The top five positions are 54% of the money. If Nvidia has a bad quarter, the other nineteen tickers will not save your month. That is the position concentration the index is built to expose, and it is invisible if you only count tickers.
If squaring twenty weights by hand isn't your idea of a Sunday, our free tool does the arithmetic and shows the effective holdings figure in one screen. See it on the live demo portfolio →
The concentration you cannot see: sector and factor
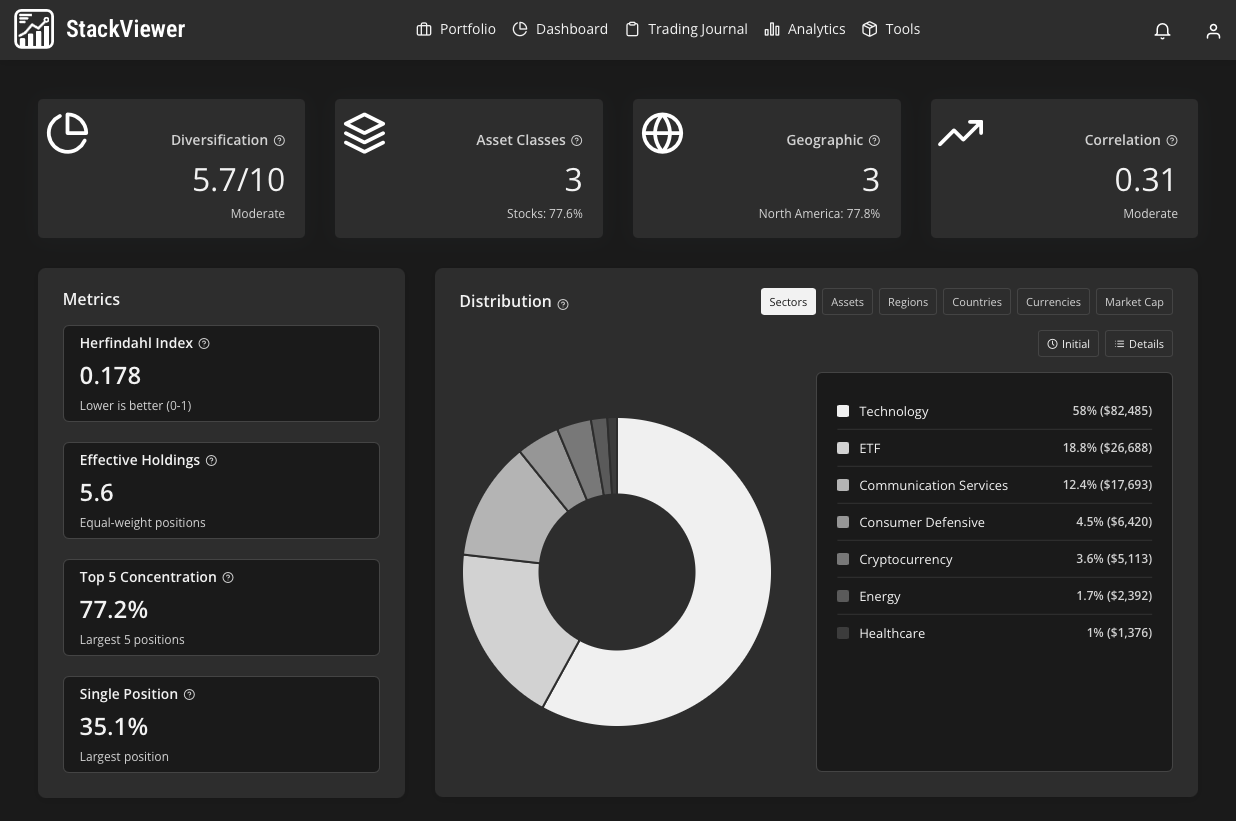
Here is the part almost every retail investor misses, and the reason a "diversified-looking" portfolio can blow up anyway. Position HHI treats each ticker as if it were independent. But stocks are not independent — they share sectors, business models, and underlying economic drivers. Run the same HHI calculation on the sectors in that twenty-stock portfolio and the picture changes completely.
Group the holdings by sector and add the weights: Technology (Nvidia, Microsoft, Apple, Broadcom) comes to 44%, Communication Services (Alphabet, Meta) to 13%, Consumer Discretionary 11%, Financials 10%, and the rest trail off into single digits. Now square the sector weights and add them: 44² + 13² + … comes to 2,448 on the points scale, or 0.2448 in decimal. That flips to an effective number of sectors of just 4.1. Twenty stocks, four-and-a-bit real sector bets — and Technology plus Communication Services together are 57% of the portfolio.
Then there is factor concentration, which is subtler still and which no sector label captures. Nvidia, Microsoft, Broadcom, Alphabet, Meta and Amazon are technically spread across three sectors, but they are all large-cap, US-listed, growth-tilted, and increasingly all tethered to the same artificial-intelligence capital-spending cycle. When that theme wobbles, they move together regardless of which sector bucket they sit in. Factor concentration — by size, geography, style (growth vs value), currency, or a shared macro driver like interest rates — is the exposure that turns "I own twenty things" into "I own one story told twenty ways".
The practical takeaway is that you should compute HHI three times: once on positions, once on sectors, and at least informally on factors (how much is US? how much is growth? how much rides on one theme?). A portfolio that scores 0.08 on positions but 0.24 on sectors is not diversified — it is concentrated in a way that only shows up when you look at the second number. This is precisely why our portfolio concentration checker reports position and sector HHI side by side, and why our wider guide to portfolio diversification spends as long on correlation as it does on counting holdings.
What this doesn't tell you
HHI is a snapshot of weights, not of risk in the fullest sense. It says nothing about how volatile each holding is, nothing about how correlated they truly are (two names in different sectors can still move together), and nothing about valuation or quality — a concentrated portfolio of steady utilities is a different animal from a concentrated portfolio of speculative tech, yet they can share an HHI. It also cannot tell you whether concentration is right for you; that depends on your time horizon, your income, and how much conviction you genuinely have. StackViewer measures the concentration you already hold and flags when it drifts — it does not tell you to sell anything, and it makes no prediction about what those positions will do next. Two more honesty notes: our values refresh roughly every 30 minutes and sync three times a day, so this is a tool for months-to-years investors reviewing structure, not for day traders watching intraday drift; and custom or unlisted assets you hold outside a connected broker will not appear in the HHI at all, which means your real concentration could be higher or lower than the number we show.
Frequently asked
- What is a good HHI for a stock portfolio?
- Lower is more diversified. Below roughly 0.10 (1,000 on the 0-10,000 scale) is broadly diversified; 0.10 to 0.18 is moderately concentrated; above 0.18 is concentrated and worth a deliberate decision rather than an accident. A quick sanity check is the effective number of holdings, which is 1 divided by the decimal HHI: a 20-stock portfolio with an HHI of 0.08 behaves like about 12 or 13 equally weighted holdings, not 20.
- Why isn't owning 20 stocks enough diversification?
- Counting positions ignores two things. First, weight: if five names make up half the portfolio, the other fifteen barely move the needle. Second, shared exposure: twenty stocks that are all large-cap US technology behave like one bet on that factor, so your sector and factor HHI can be dangerously high even when your position HHI looks fine. True diversification comes from holdings that do not move together, not from the raw number of tickers.
See your real concentration in one screen
Connect your brokers read-only and StackViewer computes position and sector HHI, your effective number of holdings, and flags where a few names quietly run the show.
See the live demo or start freeNo credit card · Read-only broker access · Free forever plan

We build a portfolio tracker and trading journal for long-term investors running two to four brokers. We write about the maths behind good decisions — and the limits of it.
This article is for information only. It is not financial, investment or tax advice, and nothing here is a recommendation to buy or sell any security. StackViewer analyses decisions you have already made; it does not predict returns. Past performance does not indicate future results.