Last reviewed 11 February 2026.
The short answer
You sell winners too early because a paper gain feels like something you can lose, and taking the money removes that discomfort — while a loss feels like something you can still fix by waiting. Psychologists call this the disposition effect: retail investors realise gains readily and cling to losers. You can measure what it costs on any single trade with one line of arithmetic: opportunity cost = (price today − your exit price) × shares sold. Do that across every early exit and the pattern — not the one trade — is what tells you whether the habit is expensive.
You bought something, it went up 30%, and a little voice said "lock it in before it gives it all back." So you sold. Then you watched it double. Meanwhile the position you're down on is still sitting in your account, because selling it would make the loss real — and you keep telling yourself it'll come back. If that describes your last twelve months, you are not undisciplined and you are not unusual. You are running one of the most reliably documented patterns in retail investing.
The problem is that "I sell my winners too early" is a feeling, and feelings don't show up on a brokerage statement. This article turns the feeling into a figure. First we'll name the behaviour plainly, then we'll work the cost by hand on three anonymised exits — including one where selling early was the correct decision — and finally we'll look at how to measure it across a whole portfolio instead of agonising over a single trade.
What the disposition effect actually is
Strip away the academic language and the disposition effect is this: we treat gains and losses as if they play by different rules. A gain that only exists on paper feels fragile — it's "yours" now, and every tick down feels like it's being taken from you. Selling makes the discomfort stop and converts an anxious paper profit into a settled, certain one. A paper loss feels different. Selling it admits you were wrong and closes the door on the recovery you're still hoping for, so you hold, sometimes for years, waiting to "get back to even."
The asymmetry matters because the two habits compound in opposite directions. Cutting winners short caps the trades that were supposed to carry the portfolio — the handful of positions that, if left alone, do most of the heavy lifting. Riding losers down ties up capital in your worst ideas. You end up with a portfolio that quietly sheds its best performers and accumulates its weakest, which is close to the exact opposite of what you intended. None of this requires you to be irrational in general; it only requires that closing a green position feels good and closing a red one feels bad. That single emotional wrinkle is enough to shape years of returns.
The reason it's so sticky is that selling a winner is rewarded immediately. You get the dopamine hit of a booked profit and a green line in your account. The cost — everything the stock did afterwards — arrives later, silently, and is easy to never look at. That delayed, invisible cost is exactly what we're going to make visible.
Put a number on it: three real exits
Here is the whole method, by hand, no software required. For any position you sold, the opportunity cost of exiting when you did is:
Opportunity cost = (price today − your exit price) × shares sold
That's it. A positive number is money the shares would have made had you held; a negative number means selling early actually protected you (more on that shortly). It's deliberately crude — it ignores what you did with the proceeds, tax, and dividends — but as a first read on "did this habit hurt me," it's honest and fast. Below are three anonymised exits from real tracked portfolios, with the figures rounded and tickers removed.
| Exit | The trade | Opportunity cost today |
|---|---|---|
| Exit A | Sold 60 shares of a software name at $128.50 after a "big enough" 40% gain; it trades at $214.00 today. | ($214.00 − $128.50) × 60 = +$5,130 |
| Exit B | Trimmed 300 shares of an industrial holding at $33.90 to "take some off the table"; now $41.20. | ($41.20 − $33.90) × 300 = +$2,190 |
| Exit C | Sold 140 shares of a speculative growth stock at $46.30 when the story soured; now $9.80. | ($9.80 − $46.30) × 140 = −$5,110 |
Exit A is the textbook case and it stings: a $5,130 gap on a single decision, driven almost entirely by the fact that a 40% gain "felt like enough." Exit B is quieter but instructive — trimming a winner "just to be safe" left $2,190 on the table, and this kind of small, sensible-feeling trim is where most of the damage actually hides, because you barely notice it. Exit C is the one people forget to include, and it changes the whole picture. We'll come back to it in a moment, because it's the reason this isn't a lecture about never selling.
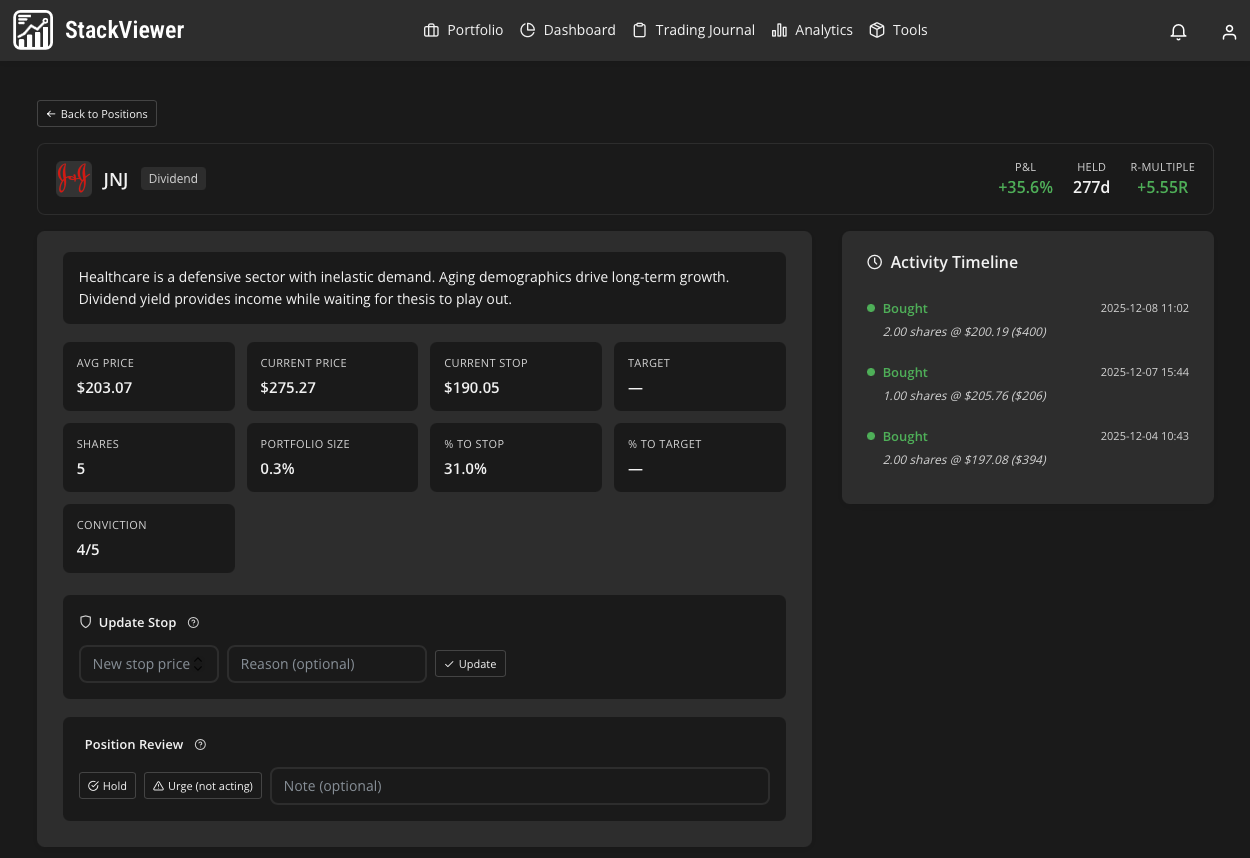
The tedious part is doing this arithmetic across dozens of exits and keeping the prices current — which is exactly the calculation a trade journal automates. See it on the live demo portfolio →
When selling early was the right call
Exit C is the counter-case, and it's essential. That speculative position was sold at $46.30 and now trades at $9.80. Plug it into the same formula and the opportunity cost is −$5,110 — a negative number, meaning selling "too early" saved roughly five thousand dollars that would otherwise have evaporated. Had that investor waited to "get back to even," they'd still be waiting, and a lot poorer.
This is the honest heart of the topic. Selling a winner early is not automatically a mistake. Sometimes the thesis genuinely broke, the valuation got silly, you needed the cash for something better, or you were rebalancing on purpose. A single early exit tells you almost nothing — markets are noisy, and any one stock can keep running or roll over for reasons that have nothing to do with your judgement. If you only ever look at the winners that got away, you'll conclude you should never sell, which is its own expensive bias. The disposition effect is a claim about your average behaviour, not a verdict on your best or worst trade.
So the right question is never "did I sell that one too early?" It's "across everything I've sold, do my early exits cost me more than they save me, and is that pattern consistent enough to act on?" One trade is an anecdote. Twenty trades with a positive average opportunity cost and a clear tag of "sold on nerves rather than thesis" — that's a habit with a price tag, and it's fixable.
Measuring it across the whole portfolio is the same formula repeated, then summed. Pull every sell from the last year or two, apply (price today − exit price) × shares to each, and add them up. If the total is a large positive number, your early exits are costing you on balance. Then split it: how much of that gap came from disciplined, planned sells versus reflexive ones you made because a gain felt "big enough" or a wobble scared you? The second bucket is the disposition effect showing up in dollars. Tag each exit with the reason and the emotion at the time and the pattern stops being a vibe — you can see, for instance, that your nerve-driven sells average +$1,400 of forgone gain while your thesis-driven sells average close to zero. That contrast is the whole game.
What this doesn't tell you
The opportunity-cost figure is deliberately simple and you should treat it that way. It ignores what you did with the proceeds — if you sold Exit A and rotated into something that outperformed, your real cost is lower or nil. It ignores dividends, tax on the realised gain, and transaction costs. It uses a single snapshot price "today," so it will read differently next week; it's a lens on a habit, not a scorecard for a trade. And it says nothing about risk — sometimes taking a certain gain off a volatile position is the sane choice even if the stock later ran, because you couldn't have stomached the drawdown in between. StackViewer's own opportunity-cost figure is deliberately different in one respect: rather than a live "today" price that keeps moving, it uses the peak price in a fixed window around your exit date, so it settles to one number instead of drifting every time you check it — useful for the app, harder to replicate by hand, which is why this walkthrough uses the simpler snapshot version instead. Either way, this is a tool for months-to-years investors reviewing decisions, not a real-time feed for day traders. It won't tell you whether your original thesis was sound — only you can judge that. Use the number to spot a pattern worth examining, then bring your own judgement to each case.
Frequently asked
- Why do I keep selling my winners too early?
- Because a paper gain feels like something you can lose, and locking it in removes that discomfort. This is the disposition effect: investors realise gains readily but hold losers hoping to break even. The pull is emotional, not analytical, which is why it repeats even when you know better.
- How do I calculate what selling early actually cost me?
- Opportunity cost = (price today minus your exit price) multiplied by the shares you sold. If you sold 60 shares at 128.50 and the stock is 214.00 today, that is (214.00 minus 128.50) times 60 = 5,130. A negative result means selling early actually saved you money.
See your own early-exit pattern in numbers
StackViewer tags every sell with your reason, conviction and emotion, then runs an opportunity-cost figure across your whole history automatically — a fixed window around each exit rather than today's live price, so the number doesn't drift as markets move — so you can tell nerve-driven exits from disciplined ones without a spreadsheet.
See the live demo or start freeNo credit card · Read-only broker access · Free forever plan

We build a portfolio tracker and trading journal for long-horizon investors running two to four brokers. We write about the behavioural patterns that quietly shape returns — and how to measure them honestly.
This article is for information only. It is not financial, investment or tax advice, and nothing here is a recommendation to buy or sell any security. StackViewer analyses decisions you have already made; it does not predict returns. Past performance does not indicate future results.